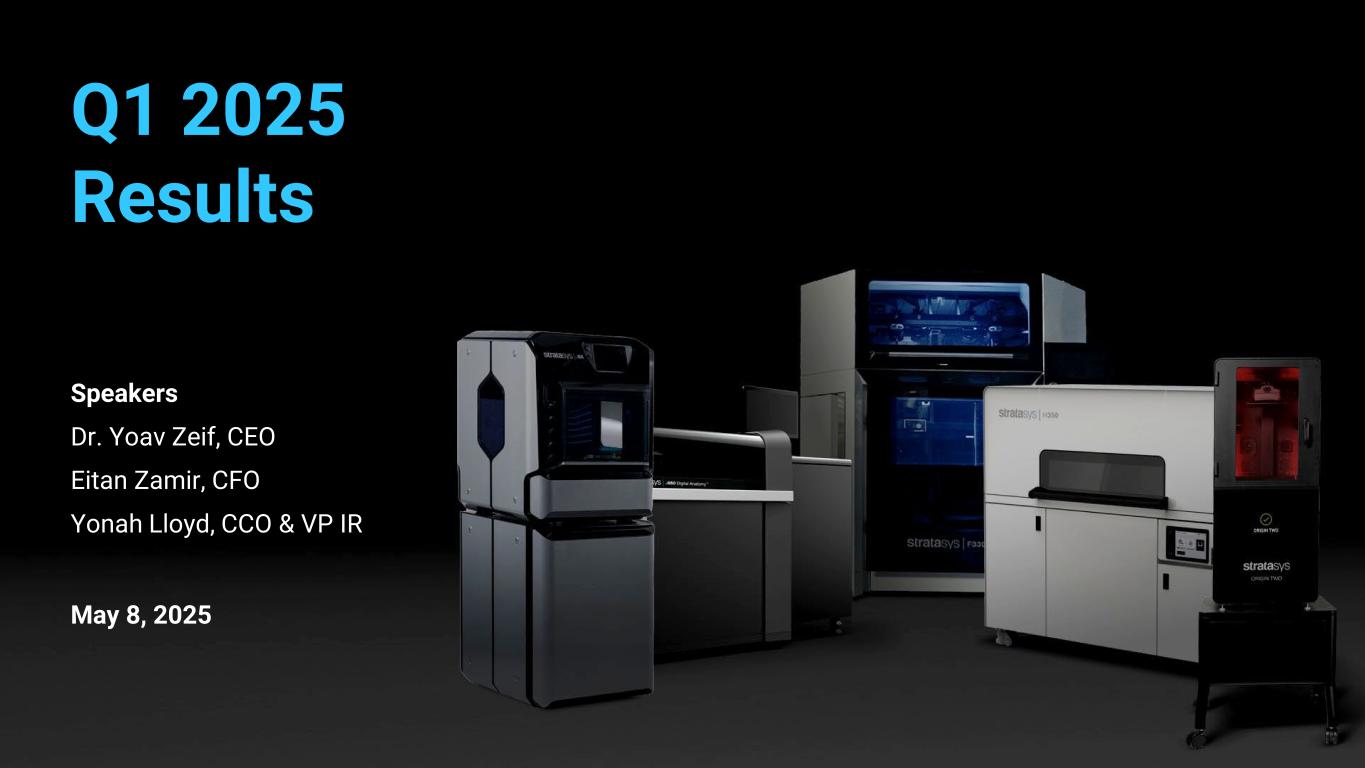
Make additive work for you Q1 2025 Results Speakers Dr. Yoav Zeif, CEO Eitan Zamir, CFO Yonah Lloyd, CCO & VP IR May 8, 2025
Conference Call and Webcast Link US Toll-Free Dial-In 1-877-407-0619 International Dial-In +1-412-902-1012 Live Webcast and Replay
Forward-Looking Statements Cautionary Statement Regarding Forward- Looking Statements The statements in this slide presentation regarding Stratasys' strategy, and the statements regarding its projected future financial performance, including the financial guidance concerning its expected results for 2025, are forward- looking statements reflecting management's current expectations and beliefs. These forward-looking statements are based on current information that is, by its nature, subject to rapid and even abrupt change. Due to risks and uncertainties associated with Stratasys' business, actual results could differ materially from those projected or implied by these forward-looking statements. These risks and uncertainties include, but are not limited to: the degree of our success at introducing new or improved products and solutions that gain market share; the extent of growth of the 3D printing sector generally; global macro-economic trends that have been adversely affecting, or that may adversely affect, the 3D printing industry generally and Stratasys particularly, including relatively high interest rates that reduce customers’ capital expenditures and new and/or reciprocal tariffs to be imposed by the United States and other countries that may disrupt our/our customers’ sales and profit margins; changes in our overall strategy, including as related to the focused restructuring actions that we have implemented to streamline operations and enhance our go-to-market strategy; the impact of potential shifts in the prices or margins of the products that we sell or services that we provide, including due to a shift towards lower margin products or services; the impact of competition, new technologies, and M&A activity among our competitors; potential further charges against earnings that we could be required to take due to impairment of additional goodwill or other intangible assets that we have recently acquired or may acquire in the future; the extent of our success at successfully integrating into our existing business, or making additional, acquisitions or investments in new businesses, technologies, products or services; potential adverse impact that recent global interruptions involving freight carriers and other third parties may have on our supply chain and distribution network; potential changes in our management and board of directors; global market, political and economic conditions, in the countries in which we operate in particular (including risks stemming from Russia’s war against Ukraine); the degree of impact of Israel’s war and military conflicts against Hamas and other regional terrorist organizations and regimes, given our Israeli headquarters, factories and significant operations; costs and potential liability relating to litigation and regulatory proceedings; risks related to infringement of our intellectual property rights by others or infringement of others' intellectual property rights by us; potential cyber attacks against, or other breaches to, our information technologies systems; the extent of our success at maintaining our liquidity and financing our operations and capital needs; the impact of tax regulations on our results of operations and financial condition; and those additional factors referred to in Item 3.D “Key Information - Risk Factors”, Item 4, “Information on the Company”, Item 5, “Operating and Financial Review and Prospects,” and all other parts of our Annual Report on Form 20-F for the year ended December 31, 2024, filed with the SEC on March 6, 2025 (the “2024 Annual Report”). Readers are urged to carefully review and consider the various disclosures made throughout our 2024 Annual Report and the Reports of Foreign Private Issuer on Form 6-K that will attach Stratasys’ unaudited, condensed consolidated financial statements and its review of its results of operations and financial condition on a quarterly basis, which Stratasys will furnish to the SEC throughout 2025, and our other reports filed with or furnished to the SEC, which are designed to advise interested parties of the risks and factors that may affect our business, financial condition, results of operations and prospects. Any guidance provided, and other forward-looking statements made, in this slide presentation are made as of the date hereof, and Stratasys undertakes no obligation to publicly update or revise any forward-looking statements, whether as a result of new information, future events or otherwise, except as required by law. Make additive work for you
Use of Non-GAAP Financial Information Use of Non-GAAP Financial Measures The non-GAAP data included herein, which excludes certain items as described below, are non-GAAP financial measures. Our management believes that these non-GAAP financial measures are useful information for investors and shareholders of our Company in gauging our results of operations (i) on an ongoing basis after excluding mergers, acquisitions, divestments and strategic process-related expense or gains and reorganization-related charges or gains, legal provisions, and (ii) excluding non- cash items such as stock-based compensation expenses, acquired intangible assets amortization, including intangible assets amortization related to equity method investments, impairment of long- lived assets and goodwill, revaluation of our investments and the corresponding tax effect of those items. The items eliminated via these non-GAAP adjustments either do not reflect actual cash outlays that impact our liquidity and our financial condition or have a non-recurring impact on the statement of operations, as assessed by management. These non-GAAP financial measures are presented to permit investors to more fully understand how management assesses our performance for internal planning and forecasting purposes. The limitations of using these non-GAAP financial measures as performance measures are that they provide a view of our results of operations without including all items indicated above during a period, which may not provide a comparable view of our performance to other companies in our industry. Investors and other readers should consider non-GAAP measures only as supplements to, not as substitutes for or as superior measures to, the measures of financial performance prepared in accordance with GAAP. Reconciliation between results on a GAAP and non-GAAP basis is provided in tables later in this slide presentation. Make additive work for you
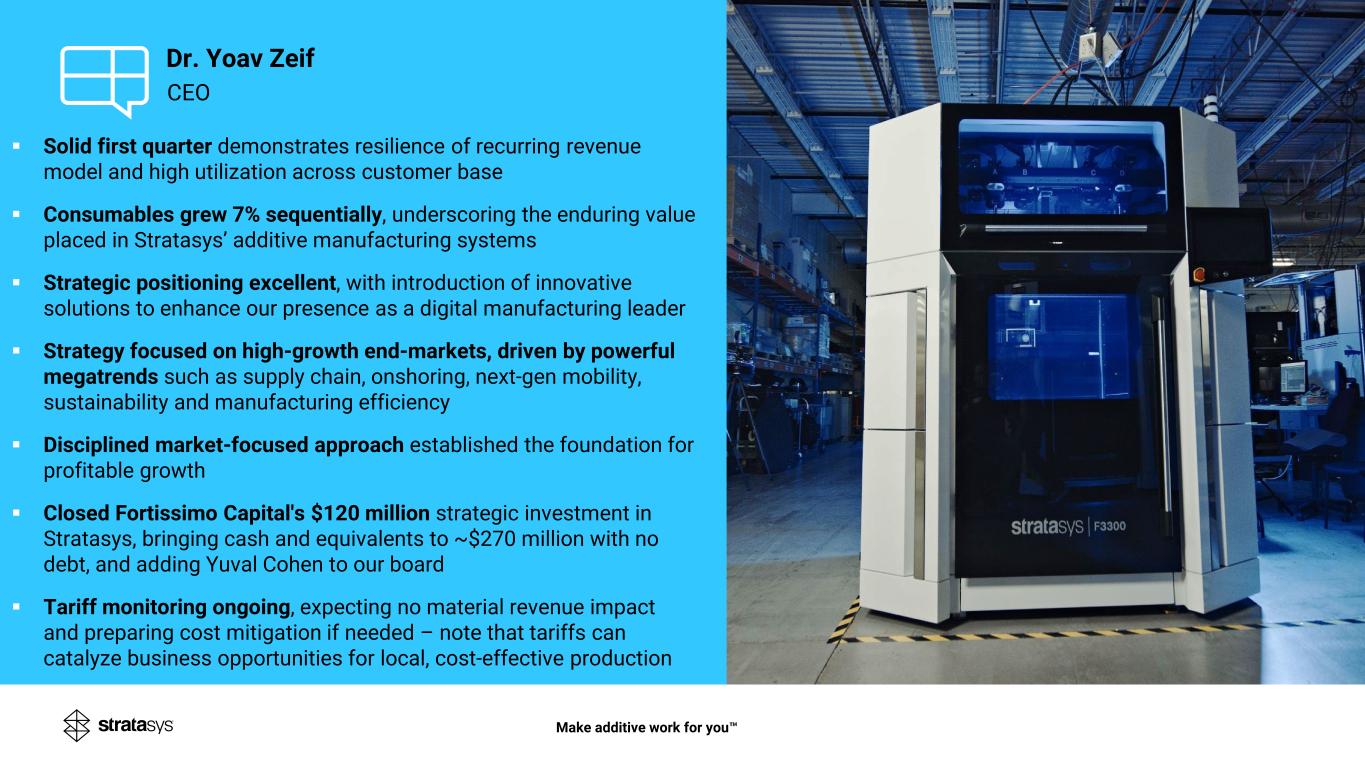
CEO Dr. Yoav Zeif Solid first quarter demonstrates resilience of recurring revenue model and high utilization across customer base Consumables grew 7% sequentially, underscoring the enduring value placed in Stratasys’ additive manufacturing systems Strategic positioning excellent, with introduction of innovative solutions to enhance our presence as a digital manufacturing leader Strategy focused on high-growth end-markets, driven by powerful megatrends such as supply chain, onshoring, next-gen mobility, sustainability and manufacturing efficiency Disciplined market-focused approach established the foundation for profitable growth Closed Fortissimo Capital's $120 million strategic investment in Stratasys, bringing cash and equivalents to ~$270 million with no debt, and adding Yuval Cohen to our board Tariff monitoring ongoing, expecting no material revenue impact and preparing cost mitigation if needed – note that tariffs can catalyze business opportunities for local, cost-effective production Make additive work for you
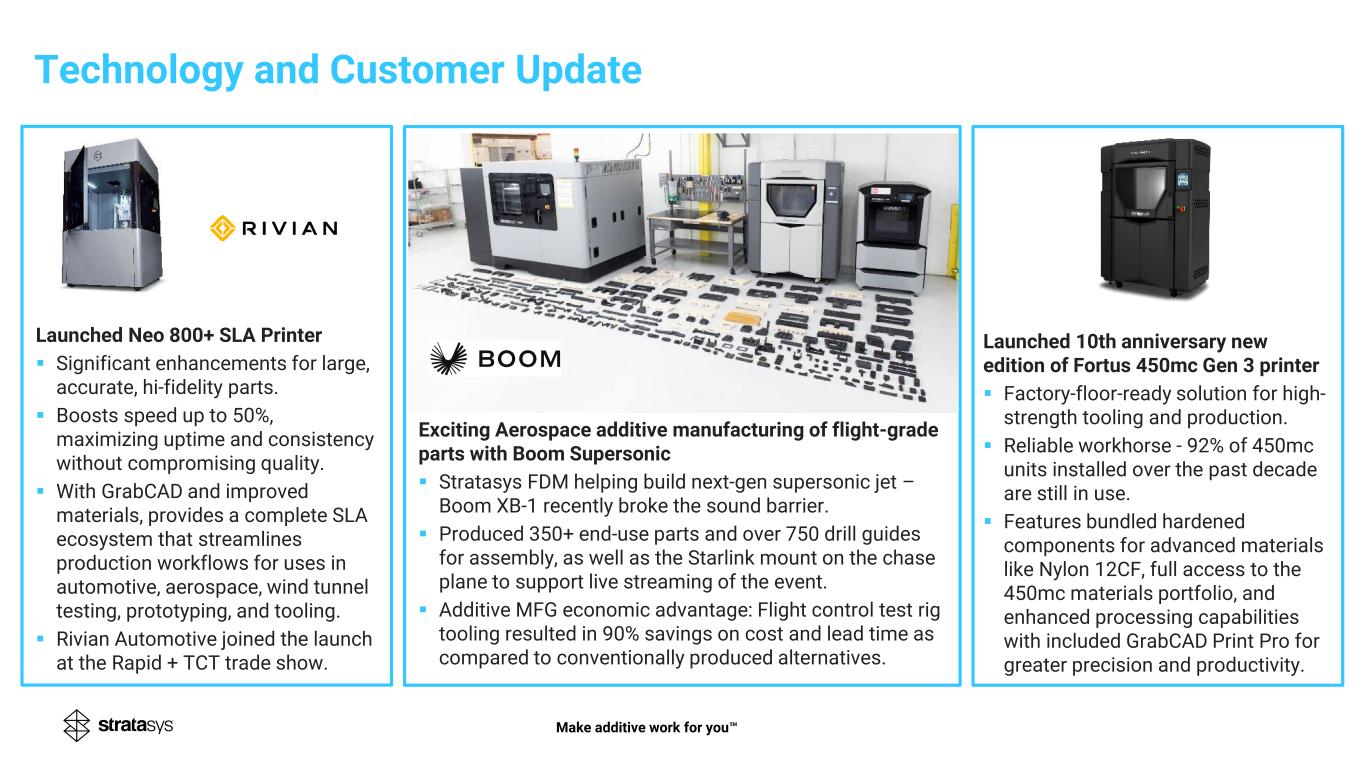
Make additive work for you Launched Neo 800+ SLA Printer Significant enhancements for large, accurate, hi-fidelity parts. Boosts speed up to 50%, maximizing uptime and consistency without compromising quality. With GrabCAD and improved materials, provides a complete SLA ecosystem that streamlines production workflows for uses in automotive, aerospace, wind tunnel testing, prototyping, and tooling. Rivian Automotive joined the launch at the Rapid + TCT trade show. Technology and Customer Update Exciting Aerospace additive manufacturing of flight-grade parts with Boom Supersonic Stratasys FDM helping build next-gen supersonic jet – Boom XB-1 recently broke the sound barrier. Produced 350+ end-use parts and over 750 drill guides for assembly, as well as the Starlink mount on the chase plane to support live streaming of the event. Additive MFG economic advantage: Flight control test rig tooling resulted in 90% savings on cost and lead time as compared to conventionally produced alternatives. Launched 10th anniversary new edition of Fortus 450mc Gen 3 printer Factory-floor-ready solution for high- strength tooling and production. Reliable workhorse - 92% of 450mc units installed over the past decade are still in use. Features bundled hardened components for advanced materials like Nylon 12CF, full access to the 450mc materials portfolio, and enhanced processing capabilities with included GrabCAD Print Pro for greater precision and productivity.
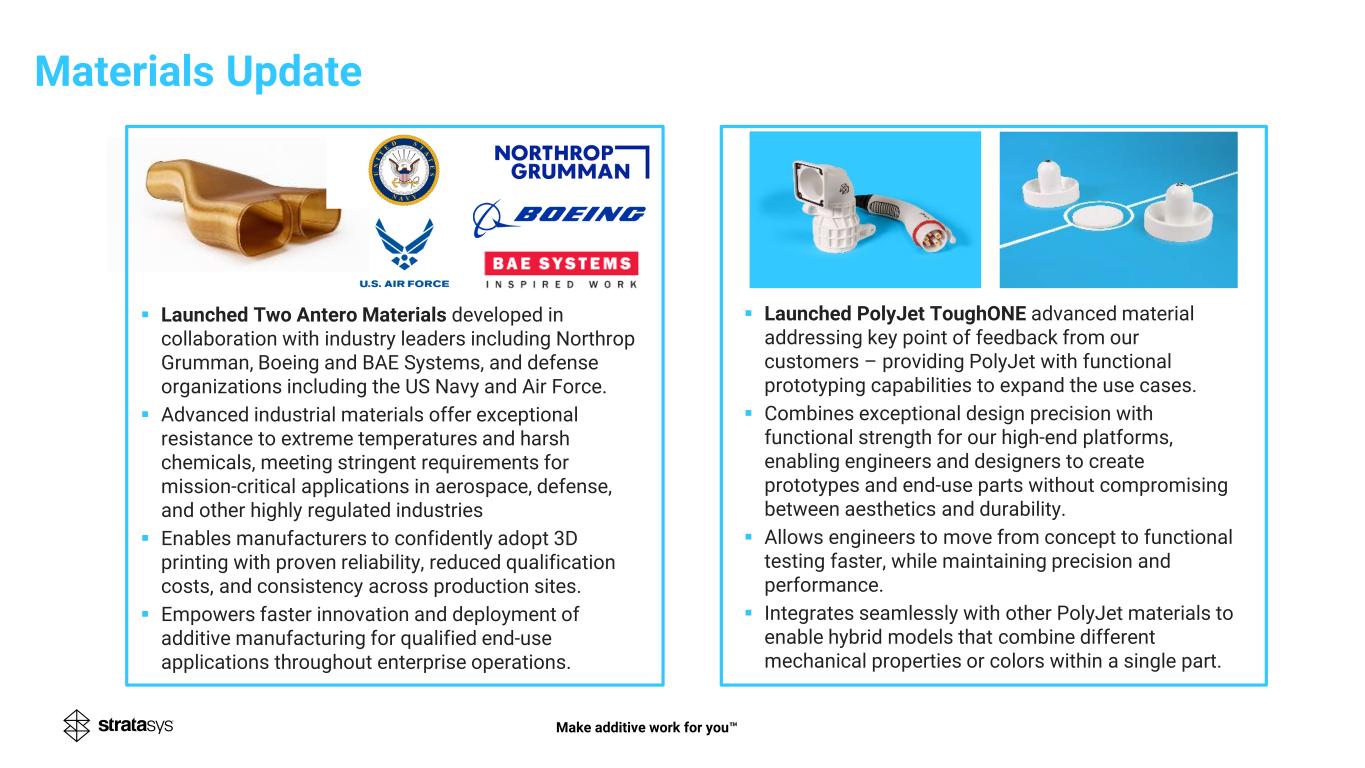
Make additive work for you Materials Update Launched Two Antero Materials developed in collaboration with industry leaders including Northrop Grumman, Boeing and BAE Systems, and defense organizations including the US Navy and Air Force. Advanced industrial materials offer exceptional resistance to extreme temperatures and harsh chemicals, meeting stringent requirements for mission-critical applications in aerospace, defense, and other highly regulated industries Enables manufacturers to confidently adopt 3D printing with proven reliability, reduced qualification costs, and consistency across production sites. Empowers faster innovation and deployment of additive manufacturing for qualified end-use applications throughout enterprise operations. Launched PolyJet ToughONE advanced material addressing key point of feedback from our customers – providing PolyJet with functional prototyping capabilities to expand the use cases. Combines exceptional design precision with functional strength for our high-end platforms, enabling engineers and designers to create prototypes and end-use parts without compromising between aesthetics and durability. Allows engineers to move from concept to functional testing faster, while maintaining precision and performance. Integrates seamlessly with other PolyJet materials to enable hybrid models that combine different mechanical properties or colors within a single part.
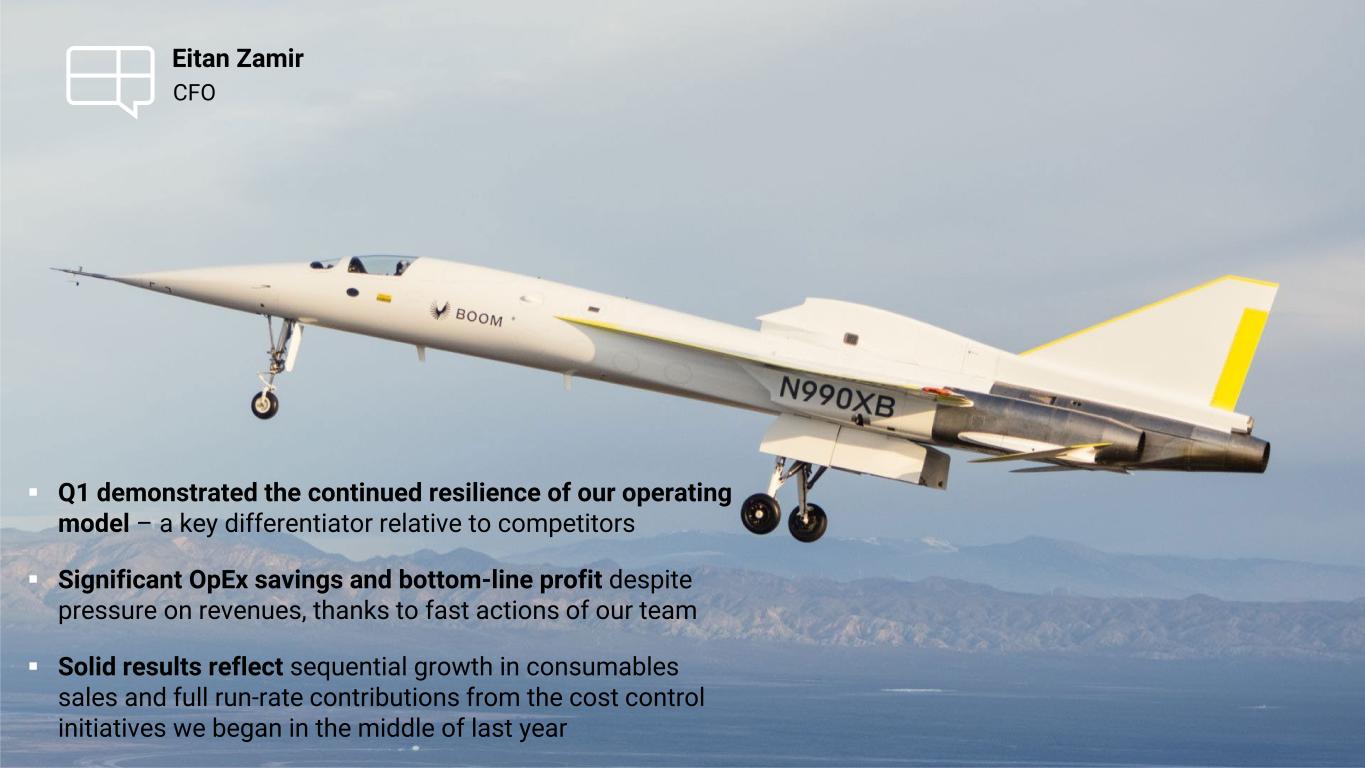
CFO Eitan Zamir Q1 demonstrated the continued resilience of our operating model – a key differentiator relative to competitors Significant OpEx savings and bottom-line profit despite pressure on revenues, thanks to fast actions of our team Solid results reflect sequential growth in consumables sales and full run-rate contributions from the cost control initiatives we began in the middle of last year
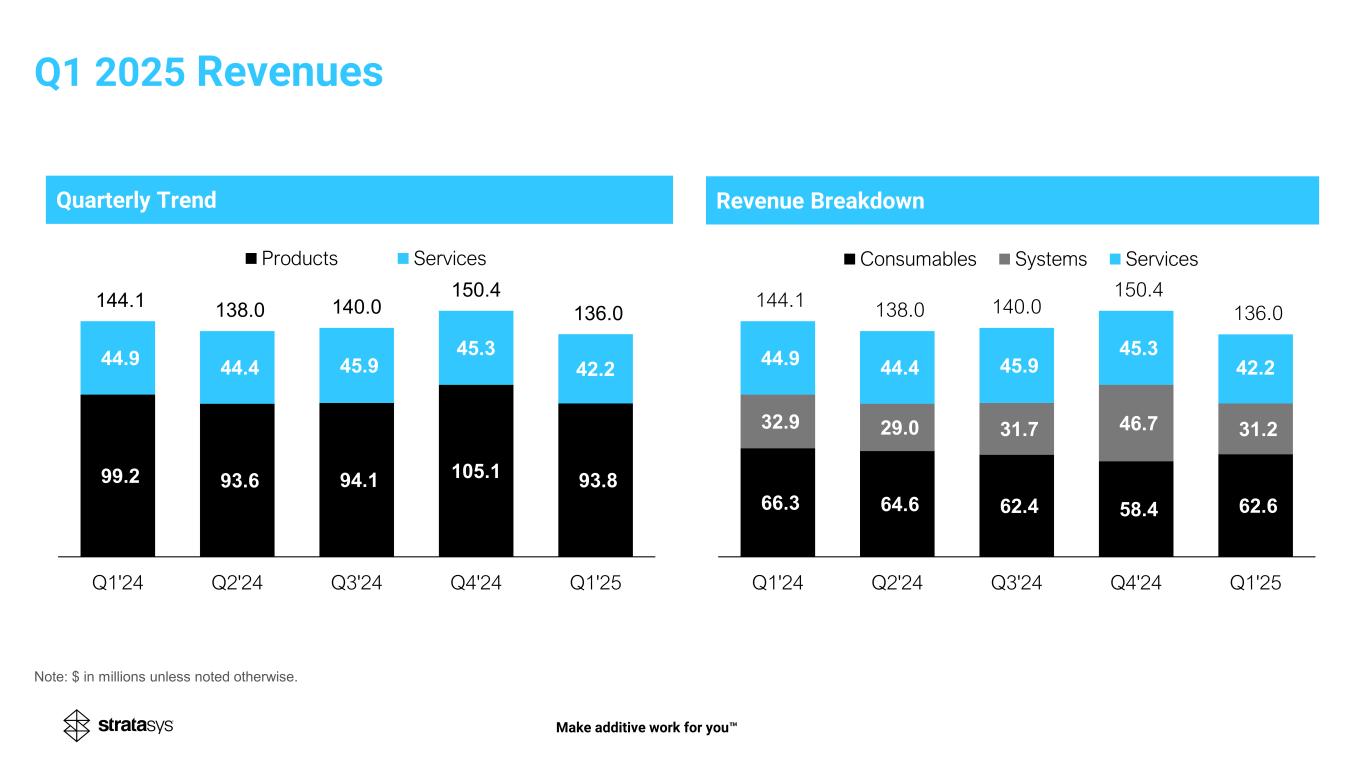
Quarterly Trend 99.2 93.6 94.1 105.1 93.8 44.9 44.4 45.9 45.3 42.2 144.1 138.0 140.0 150.4 136.0 Q1'24 Q2'24 Q3'24 Q4'24 Q1'25 Products Services Q1 2025 Revenues Make additive work for you Revenue Breakdown Note: $ in millions unless noted otherwise. 66.3 64.6 62.4 58.4 62.6 32.9 29.0 31.7 46.7 31.2 44.9 44.4 45.9 45.3 42.2 144.1 138.0 140.0 150.4 136.0 Q1'24 Q2'24 Q3'24 Q4'24 Q1'25 Consumables Systems Services
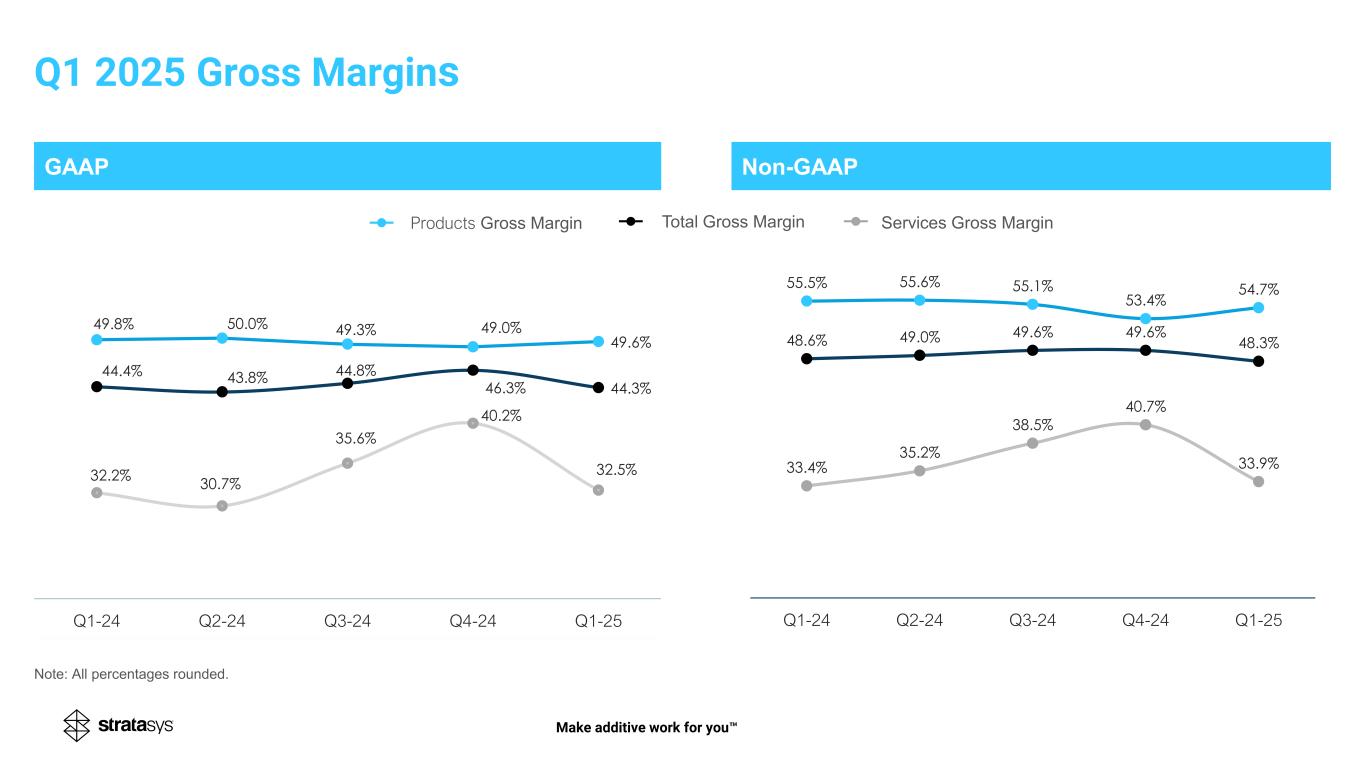
GAAP Non-GAAP 47.4% 47.2% 49.8% 50.0% 49.3% 24.4% 38.4% 32.2% 30.7% 35.6% 40.5% 44.6% 44.4% 43.8% 44.8% Q3-23 Q4-23 Q1-24 Q2-24 Q3-24 48.6% 49.0% 49.6% 49.6% 48.3% 55.5% 55.6% 55.1% 53.4% 54.7% 33.4% 35.2% 38.5% 40.7% 33.9% Q1-24 Q2-24 Q3-24 Q4-24 Q1-25 Services Gross MarginProducts Gross Margin Total Gross Margin Make additive work for you . . . . . . . . . . . . . . . - - - - - 47.4% 47.2% 49.8% 50.0% 49.3% 24.4% 38.4% 32.2% 30.7% 35.6% 40.5% 44.6% 44.4% 43.8% 44.8% Q3-23 Q4-23 Q1-24 Q2-24 Q3-24 49.8% 50.0% 49.3% 49.0 49.6% 32.2% 30.7% 35.6% 40.2% 32.5% 44.4% 43.8% 44.8% 46.3% 44.3% Q1-24 Q2-24 Q3-24 Q4-24 Q1-25 Q1 2025 Gross Margins Note: All percentages rounded.
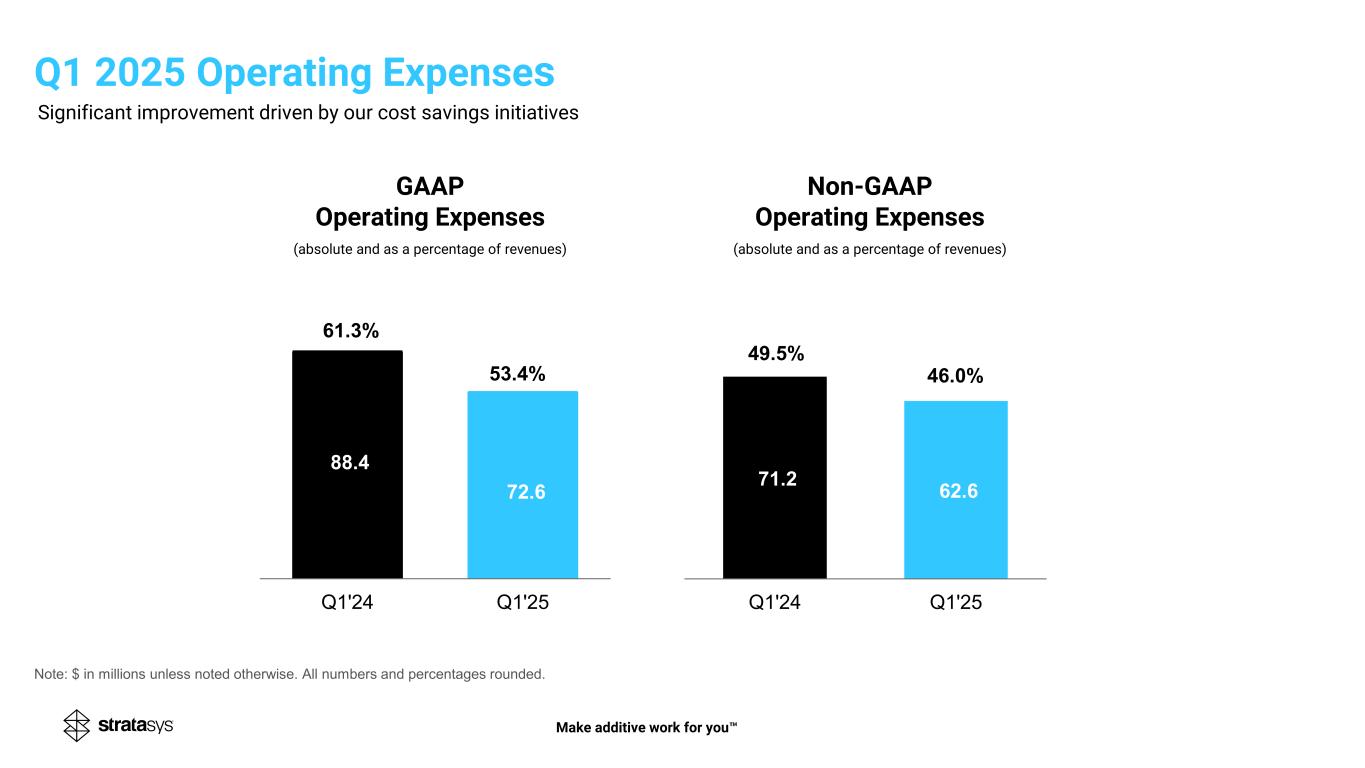
GAAP Operating Expenses (absolute and as a percentage of revenues) Non-GAAP Operating Expenses (absolute and as a percentage of revenues) 88.4 72.6 53.4% Q1'24 Q1'25 61.3% 71.2 62.6 Q1'24 Q1'25 46.0%41.0% 49.5% Significant improvement driven by our cost savings initiatives Note: $ in millions unless noted otherwise. All numbers and percentages rounded. Q1 2025 Operating Expenses Make additive work for you
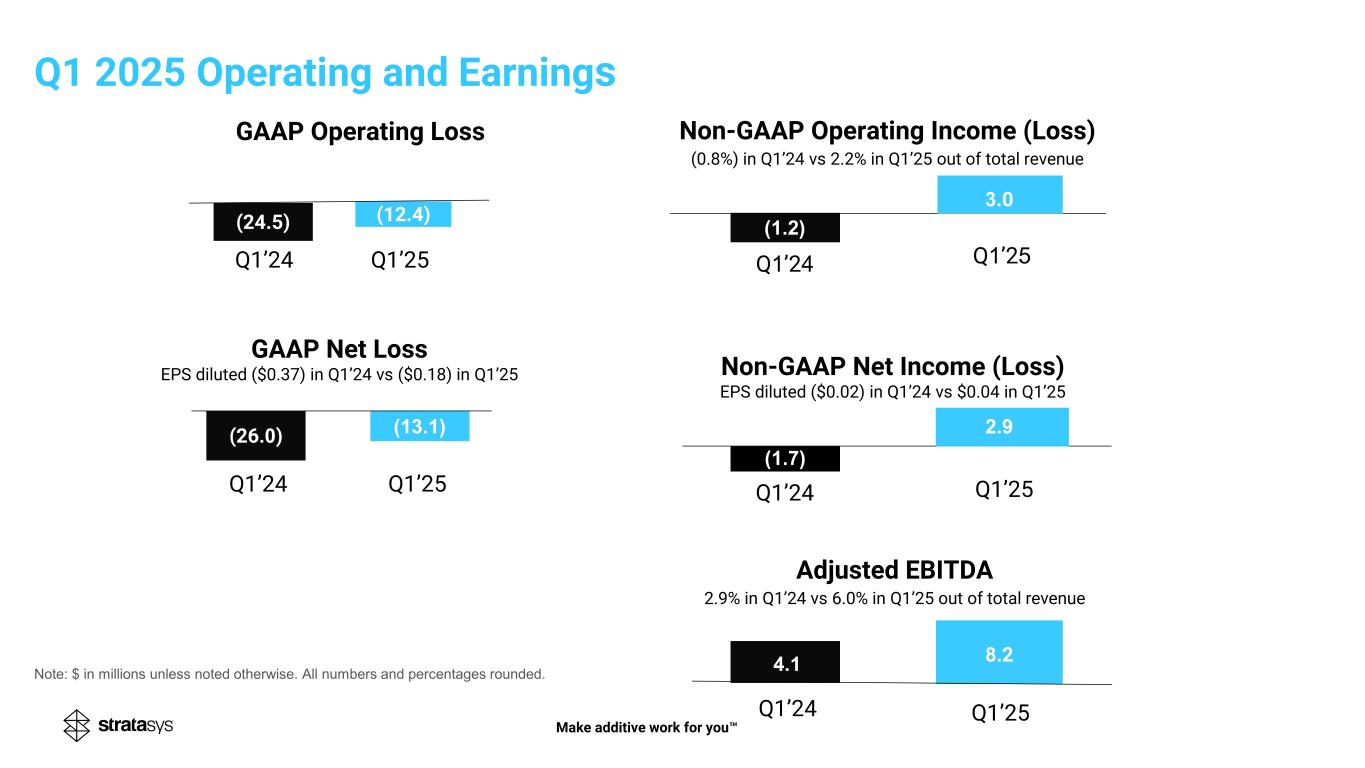
(26.0) )13.1( (12.4) Non-GAAP Operating Income (Loss) (0.8%) in Q1’24 vs 2.2% in Q1’25 out of total revenue GAAP Operating Loss Non-GAAP Net Income (Loss) EPS diluted ($0.02) in Q1’24 vs $0.04 in Q1’25 GAAP Net Loss EPS diluted ($0.37) in Q1’24 vs ($0.18) in Q1’25 Q1’24 Q1’25 8.24.1 2.9 Adjusted EBITDA 2.9% in Q1’24 vs 6.0% in Q1’25 out of total revenue )1.2( 3.0 )1.7( Q1’24 Q1’25 Q1’24 Q1’25 Q1’24 Q1’25 Q1’24 Q1’25 (24.5) Q1 2025 Operating and Earnings Note: $ in millions unless noted otherwise. All numbers and percentages rounded. Make additive work for you
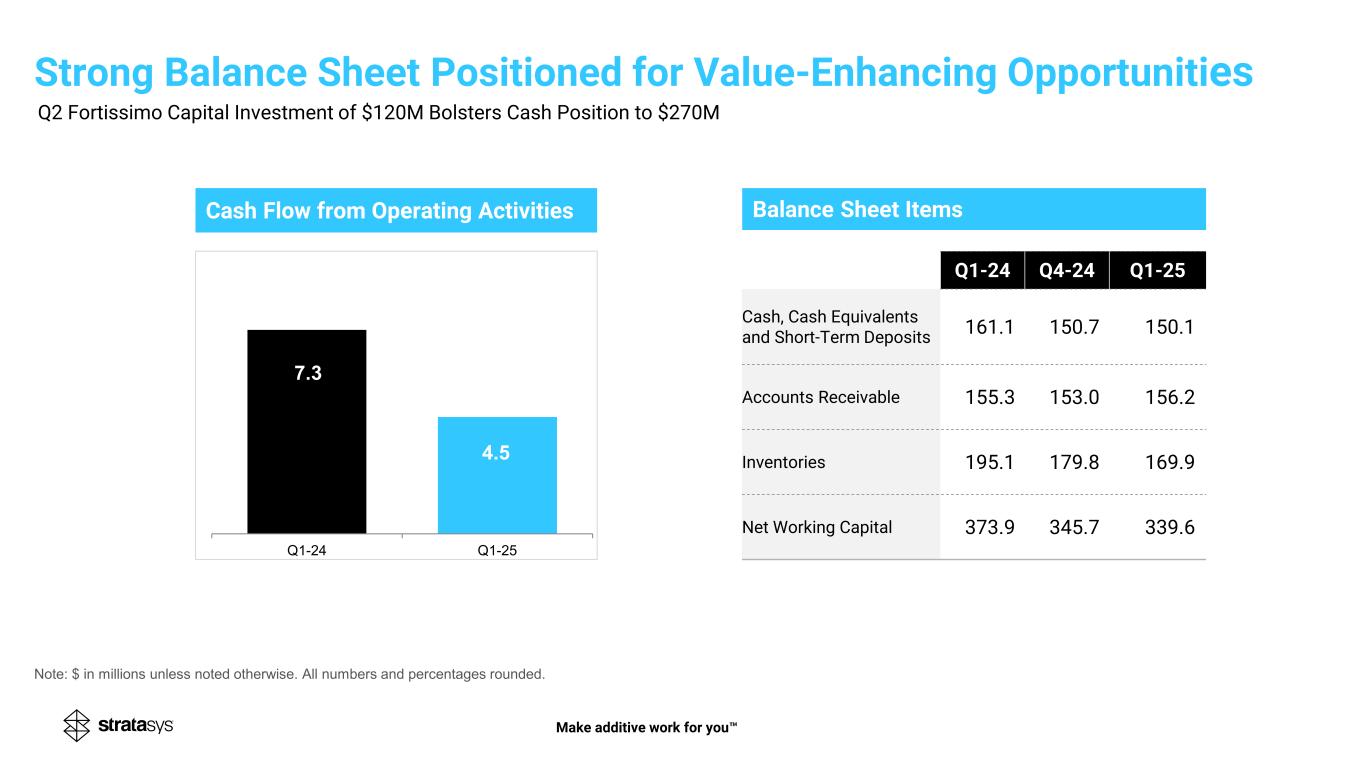
Balance Sheet ItemsCash Flow from Operating Activities 13 Q1-24 Q4-24 Q1-25 Cash, Cash Equivalents and Short-Term Deposits 161.1 150.7 150.1 Accounts Receivable 155.3 153.0 156.2 Inventories 195.1 179.8 169.9 Net Working Capital 373.9 345.7 339.6 7.3 4.5 Q1-24 Q1-25 Note: $ in millions unless noted otherwise. All numbers and percentages rounded. Make additive work for you Strong Balance Sheet Positioned for Value-Enhancing Opportunities Q2 Fortissimo Capital Investment of $120M Bolsters Cash Position to $270M
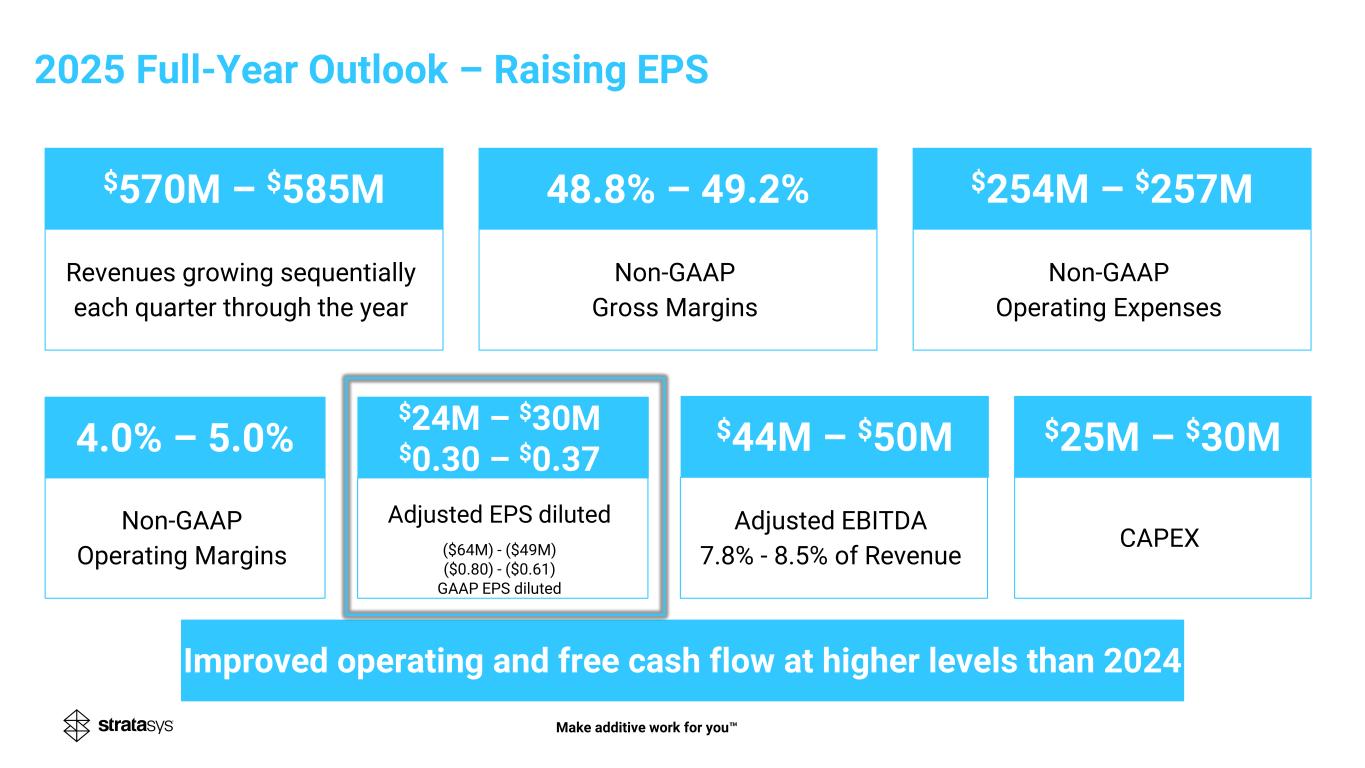
Revenues growing sequentially each quarter through the year Non-GAAP Gross Margins Non-GAAP Operating Expenses Non-GAAP Operating Margins Adjusted EPS diluted ($64M) - ($49M) ($0.80) - ($0.61) GAAP EPS diluted CAPEX Adjusted EBITDA 7.8% - 8.5% of Revenue $570M – $585M 48.8% – 49.2% $254M – $257M $25M – $30M$44M – $50M4.0% – 5.0% Improved operating and free cash flow at higher levels than 2024 2025 Full-Year Outlook – Raising EPS $24M – $30M $0.30 – $0.37 Make additive work for you
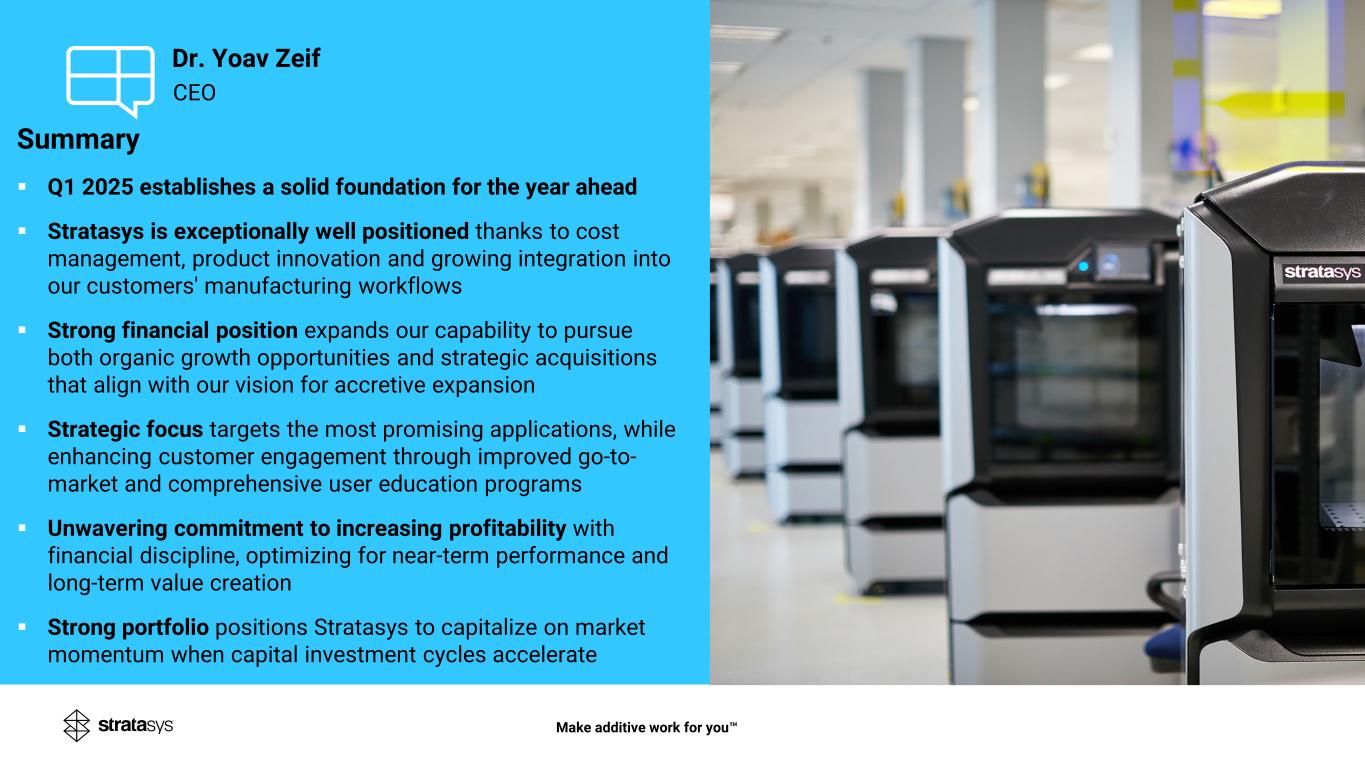
CEO Dr. Yoav Zeif Summary Q1 2025 establishes a solid foundation for the year ahead Stratasys is exceptionally well positioned thanks to cost management, product innovation and growing integration into our customers' manufacturing workflows Strong financial position expands our capability to pursue both organic growth opportunities and strategic acquisitions that align with our vision for accretive expansion Strategic focus targets the most promising applications, while enhancing customer engagement through improved go-to- market and comprehensive user education programs Unwavering commitment to increasing profitability with financial discipline, optimizing for near-term performance and long-term value creation Strong portfolio positions Stratasys to capitalize on market momentum when capital investment cycles accelerate Make additive work for you
Make additive work for you THANK YOU
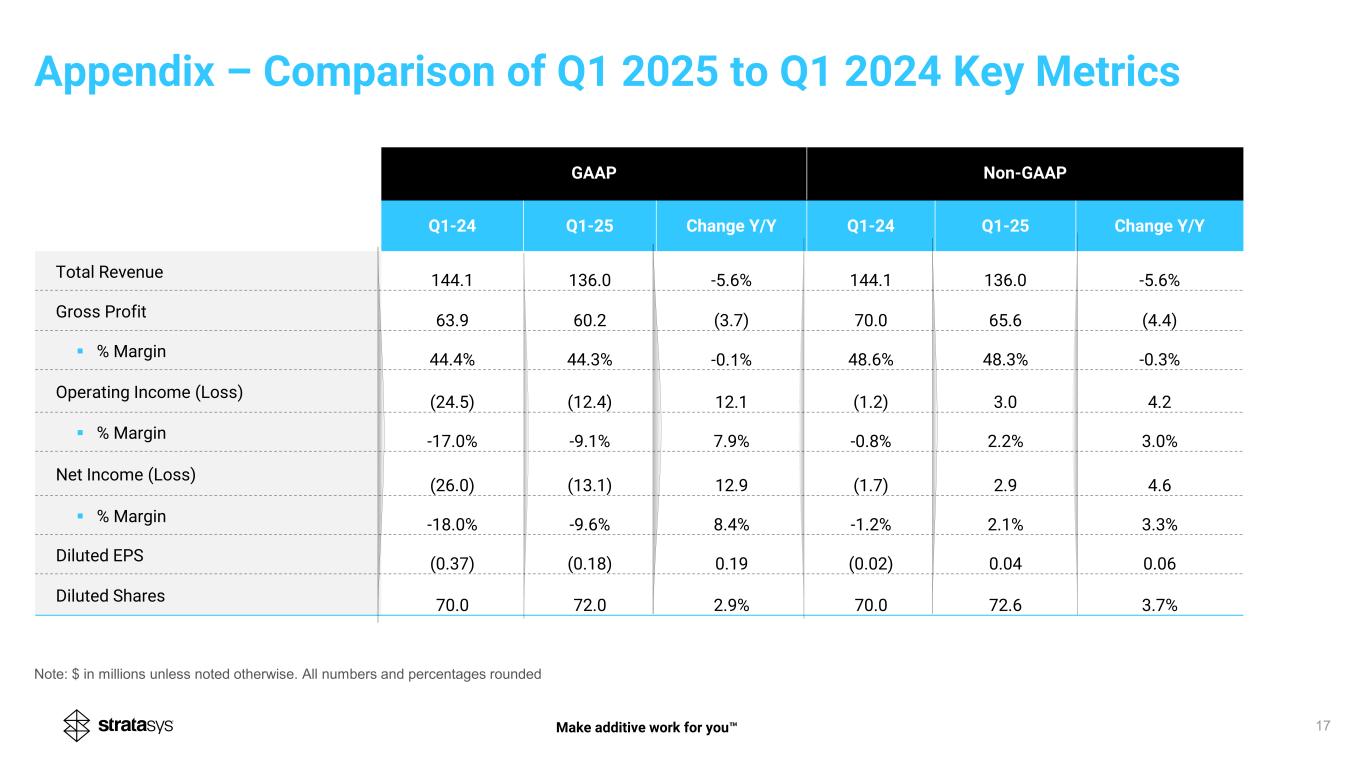
17 GAAP Non-GAAP Q1-24 Q1-25 Change Y/Y Q1-24 Q1-25 Change Y/Y Total Revenue 144.1 136.0 -5.6% 144.1 136.0 -5.6% Gross Profit 63.9 60.2 (3.7) 70.0 65.6 (4.4) % Margin 44.4% 44.3% -0.1% 48.6% 48.3% -0.3% Operating Income (Loss) (24.5) (12.4) 12.1 (1.2) 3.0 4.2 % Margin -17.0% -9.1% 7.9% -0.8% 2.2% 3.0% Net Income (Loss) (26.0) (13.1) 12.9 (1.7) 2.9 4.6 % Margin -18.0% -9.6% 8.4% -1.2% 2.1% 3.3% Diluted EPS (0.37) (0.18) 0.19 (0.02) 0.04 0.06 Diluted Shares 70.0 72.0 2.9% 70.0 72.6 3.7% Note: $ in millions unless noted otherwise. All numbers and percentages rounded Appendix – Comparison of Q1 2025 to Q1 2024 Key Metrics Make additive work for you
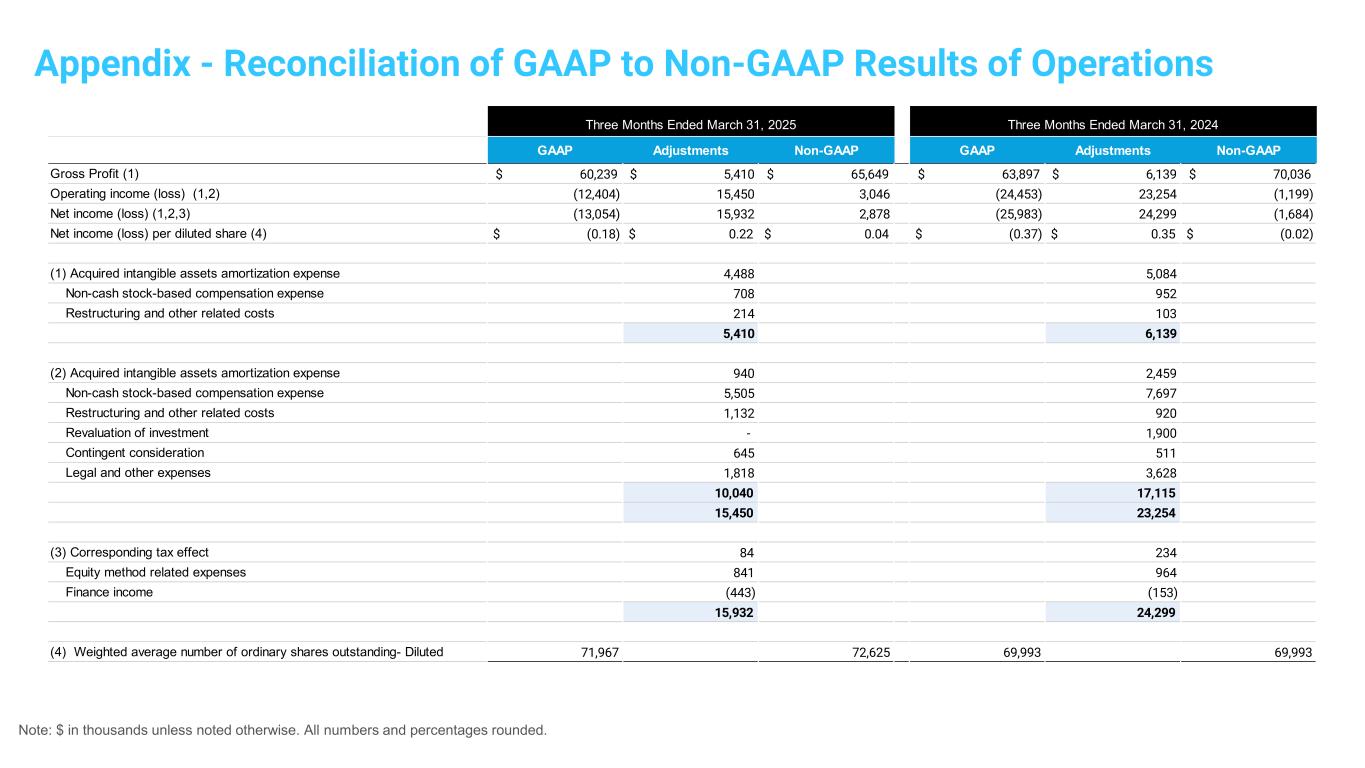
Note: $ in thousands unless noted otherwise. All numbers and percentages rounded. Appendix - Reconciliation of GAAP to Non-GAAP Results of Operations GAAP Adjustments Non-GAAP GAAP Adjustments Non-GAAP Gross Profit (1) $ 60,239 $ 5,410 $ 65,649 $ 63,897 $ 6,139 $ 70,036 Operating income (loss) (1,2) (12,404) 15,450 3,046 (24,453) 23,254 (1,199) Net income (loss) (1,2,3) (13,054) 15,932 2,878 (25,983) 24,299 (1,684) Net income (loss) per diluted share (4) $ (0.18) $ 0.22 $ 0.04 $ (0.37) $ 0.35 $ (0.02) (1) Acquired intangible assets amortization expense 4,488 5,084 Non-cash stock-based compensation expense 708 952 Restructuring and other related costs 214 103 5,410 6,139 (2) Acquired intangible assets amortization expense 940 2,459 Non-cash stock-based compensation expense 5,505 7,697 Restructuring and other related costs 1,132 920 Revaluation of investment - 1,900 Contingent consideration 645 511 Legal and other expenses 1,818 3,628 10,040 17,115 15,450 23,254 (3) Corresponding tax effect 84 234 Equity method related expenses 841 964 Finance income (443) (153) 15,932 24,299 (4) Weighted average number of ordinary shares outstanding- Diluted 71,967 72,625 69,993 69,993 Three Months Ended March 31, 2025 Three Months Ended March 31, 2024
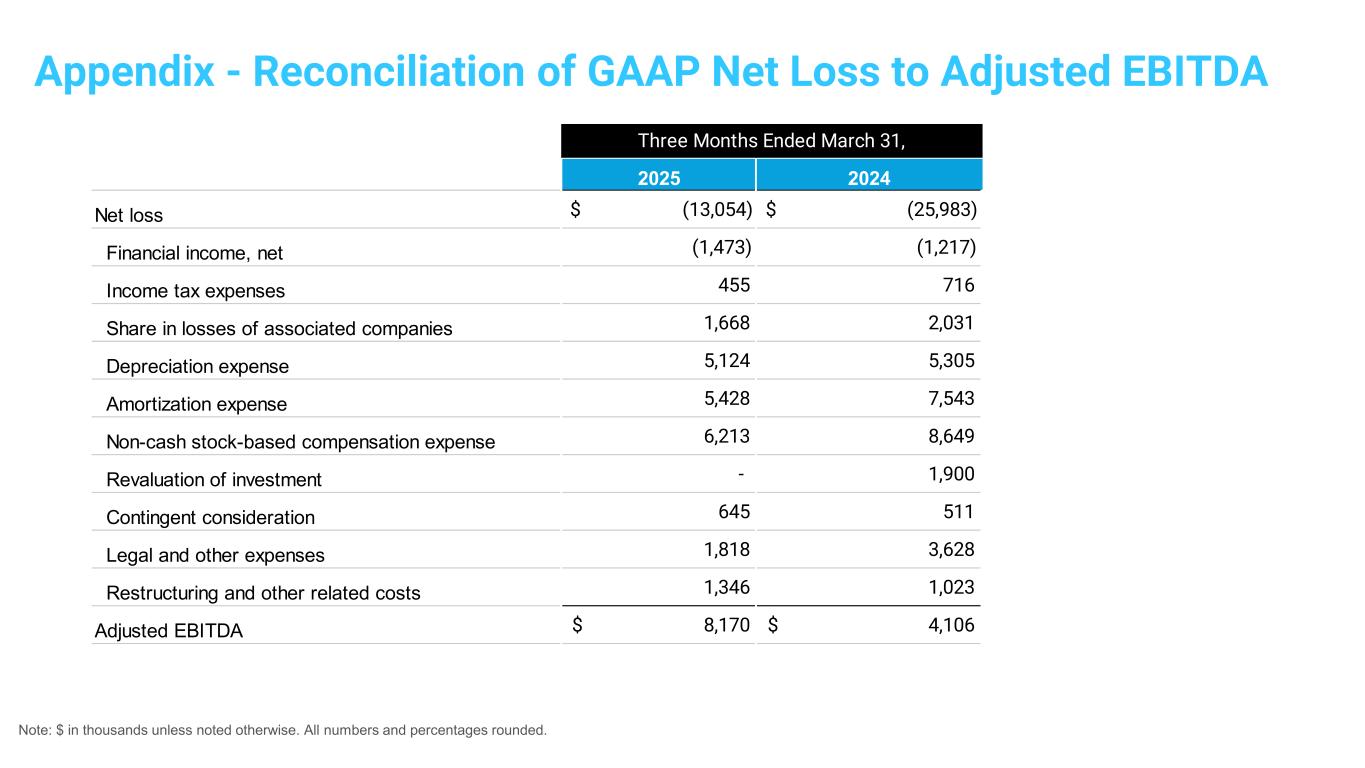
Note: $ in thousands unless noted otherwise. All numbers and percentages rounded. Appendix - Reconciliation of GAAP Net Loss to Adjusted EBITDA 2025 2024 Net loss $ (13,054) $ (25,983) Financial income, net (1,473) (1,217) Income tax expenses 455 716 Share in losses of associated companies 1,668 2,031 Depreciation expense 5,124 5,305 Amortization expense 5,428 7,543 Non-cash stock-based compensation expense 6,213 8,649 Revaluation of investment - 1,900 Contingent consideration 645 511 Legal and other expenses 1,818 3,628 Restructuring and other related costs 1,346 1,023 Adjusted EBITDA $ 8,170 $ 4,106 Three Months Ended March 31,