Exhibit 99.2
Make additive work for you Q1 2024 Results Speakers Dr. Yoav Zeif, CEO Eitan Zamir, CFO Yonah Lloyd, CCO & VP IR May 29 , 2024

Conference Call and Webcast Details US Toll - Free Dial - In 1 - 877 - 407 - 0619 International Dial - In + 1 - 412 - 902 - 1012 Live Webcast and Replay https://event.choruscall.com/mediaframe/ webcast.html?webcastid=H 13 Rjkjs Make additive work for you
Forward - Looking Statements Cautionary Statement Regarding Forward - Looking Statements The statements in this slide presentation regarding Stratasys' strategy, and the statements regarding its projected future financial performance, including the financial guidance concerning its expected results for 2024, are forward - looking statements reflecting management's current expectations and beliefs. These forward - looking statements are based on current information that is, by its nature, subject to rapid and even abrupt change. Due to risks and uncertainties associated with Stratasys' business, actual results could differ materially from those projected or implied by these forward - looking statements. These risks and uncertainties include, but are not limited to: the degree of our success at introducing new or improved products and solutions that gain market share; the extent of growth of the 3D printing market generally; global macro - economic trends that have been adversely affecting, and may continue to adversely affect, our results, including inflationary pressures and higher interest rates that reduce capital expenditures; the impact of potential shifts in the prices or margins of the products that we sell or services that we provide, including due to a shift towards lower margin products or services; the impact of competition and new technologies; the outcome of our board’s comprehensive process to explore strategic alternatives for our company; potential further charges against earnings that we could be required to take due to impairment of additional goodwill or other intangible assets that we have recently acquired or may acquire in the future; the extent of our success at successfully integrating into our existing business, or making additional, acquisitions or investments in new businesses, technologies, products or services ; potential adverse impact that recent global interruptions involving freight carriers and other third parties may have on our supply chain and distribution network; potential changes in our management and board of directors; global market, political and economic conditions, in the countries in which we operate in particular (including risks stemming from Russia’s invasion of Ukraine); the degree of impact of I srael’s war against the terrorist organization Hamas, given our Israeli headquarters, factories and significant operations; costs and potential liability relating to litigation and regulatory proceedings; risks related to infringement of our intellectual property rights by others or infringement of others' intellectual property rights by us; potential cyber attacks against, or other breaches to, our information technologies systems; the extent of our success at maintaining our liquidity and financing our operations and capital needs; the impact of tax regulations on our results of operations and financial condition; and those additional factors referred to in Item 3.D “Key Information - Risk Factors”, Item 4, “Information on the Company”, Item 5, “Operating and Financial Review and Prospects,” and all other parts of our Annual Report on Form 20 - F for the year ended December 31, 2023, filed with the SEC on March 11, 2024 (the “2023 Annual Report”). Readers are urged to carefully review and consider the various disclosures made throughout our 2023 Annual Report and the Report of Foreign Private Issuer on Form 6 - K that will attach Stratasys’ unaudited, condensed consolidated financial statements and its review of its results of operations and financial condition for the quarter ended March 31, 2024, which Stratasys will furnish to the SEC on or about May 30, 2024, and our other reports filed with or furnished to the SEC, which are designed to advise interested parties of the risks and factors that may affect our business, financial condition, results of operations and prospects. Any guidance provided, and other forward - looking statements made, in this slide presentation are made as of the date hereof, and Stratasys undertakes no obligation to publicly update or revise any forward - looking statements, whether as a result of new information, future events or otherwise, except as required by law. Make additive work for you
Use of Non - GAAP Financial Information Use of Non - GAAP Financial Measures The non - GAAP data included herein, which excludes certain items as described below, are non - GAAP financial measures. Our management believes that these non - GAAP financial measures are useful information for investors and shareholders of our Company in gauging our results of operations (i) on an ongoing basis after excluding mergers, acquisitions, divestments and strategic process - related expense or gains and reorganization - related charges or gains, legal provisions, and (ii) excluding non - cash items such as stock - based compensation expenses, acquired intangible assets amortization, including intangible assets amortization related to equity method investments, impairment of long - lived assets and goodwill, revaluation of our investments and the corresponding tax effect of those items. The items eliminated via these non - GAAP adjustments either do not reflect actual cash outlays that impact our liquidity and our financial condition or have a non - recurring impact on the statement of operations, as assessed by management. These non - GAAP financial measures are presented to permit investors to more fully understand how management assesses our performance for internal planning and forecasting purposes. The limitations of using these non - GAAP financial measures as performance measures are that they provide a view of our results of operations without including all items indicated above during a period, which may not provide a comparable view of our performance to other companies in our industry. Investors and other readers should consider non - GAAP measures only as supplements to, not as substitutes for or as superior measures to, the measures of financial performance prepared in accordance with GAAP. Reconciliation between results on a GAAP and non - GAAP basis is provided in a table later in this slide presentation. Make additive work for you

CEO Dr. Yoav Zeif ▪ Revenue flat relative to Q1 2023 after backing out divestitures ▪ Improved Gross Margins of 48.6% vs. 47.3% in Q1 2023 ▪ Highest - ever Consumables recurring revenue reflects strong usage, demonstrates impact of revenue stream ▪ Generated $7M+ in operating cash flow + FCF positive ▪ Financial discipline strong differentiator in our sector ▪ Healthy balance sheet provides stability and optionality to support our growth ▪ As capital spending normalizes, our differentiated, industry - leading solutions position us to meaningfully accelerate growth and drive shareholder returns Make additive work for you

H350 launched v.1.5 New SAF HighDef printing capabilities provides additional applications and use cases for a growing set of manufacturing sectors, without compromising speed or quality F3300 establishes a new FDM standard for industrial MFG with up to 2X throughput of standard FDM Strong customer pipeline Toyota - first customer BAE Systems – Europe’s largest defense contractor to drive production improvements Sikorsky - world leader in vertical flight seeks faster, cost - effective production of end - use parts Nissan – F3300 replacing 3DP competitor for multiple use cases Industrial Manufacturing Systems Update – F3300 and H350 Make additive work for you

Published 2 nd ESG and Sustainability report Sustainability is at the heart of what 3D Printing can mean for the world, and of who we are at Stratasys Proud to lead our industry on this front, and invite you to review the report Leading the shift to Mindful Manufacturing Promotion of our new COO, Amir Kleiner – 12+ years at Stratasys Will lead Global Operations, MIS, and Quality team, while continuing to manage the Customer Success team Strengthening the connection between the Customer Success organization and the Operations and Supply Chain divisions. Recent Events – New COO / Second Sustainability Report FBFFFFFFÏB FBFFFFFFÏB Make additive work for you
CFO Eitan Zamir ▪ Encouraged by multiple improvements relative to Q1 2023 ▪ Despite relatively flat revenues, gross margins improved, thanks in part to another record - level in sales of our consumables ▪ Generated over $7 million in operating cash and over $4 million in free cash flow Make additive work for you

Note: $ in millions unless noted otherwise. All numbers and percentages rounded Financial Results Make additive work for you Q1-23 Q1-24 Change Y/Y Q1-23 Q1-24 Change Y/Y Total Revenue 149.4 144.1 -3.5% 149.4 144.1 -3.5% Gross Profit 65.4 63.9 (1.5) 70.7 70.0 (0.7) ▪ % Margin 43.8% 44.4% 0.6% 47.3% 48.6% 1.3% Operating Income (Loss) (16.8) (24.5) (7.7) 1.5 (1.2) (2.7) ▪ % Margin -11.2% -17.0% -5.8% 1.0% -0.8% -1.8% Net Income (Loss) (22.2) (26.0) (3.8) 1.1 (1.7) (2.8) ▪ % Margin -14.9% -18.0% -3.1% 0.7% -1.2% -1.9% Diluted EPS (0.33) (0.37) (0.04) 0.02 (0.02) (0.04) Diluted Shares 67.6 70.0 3.6% 68.1 70.0 2.8% GAAP Non-GAAP
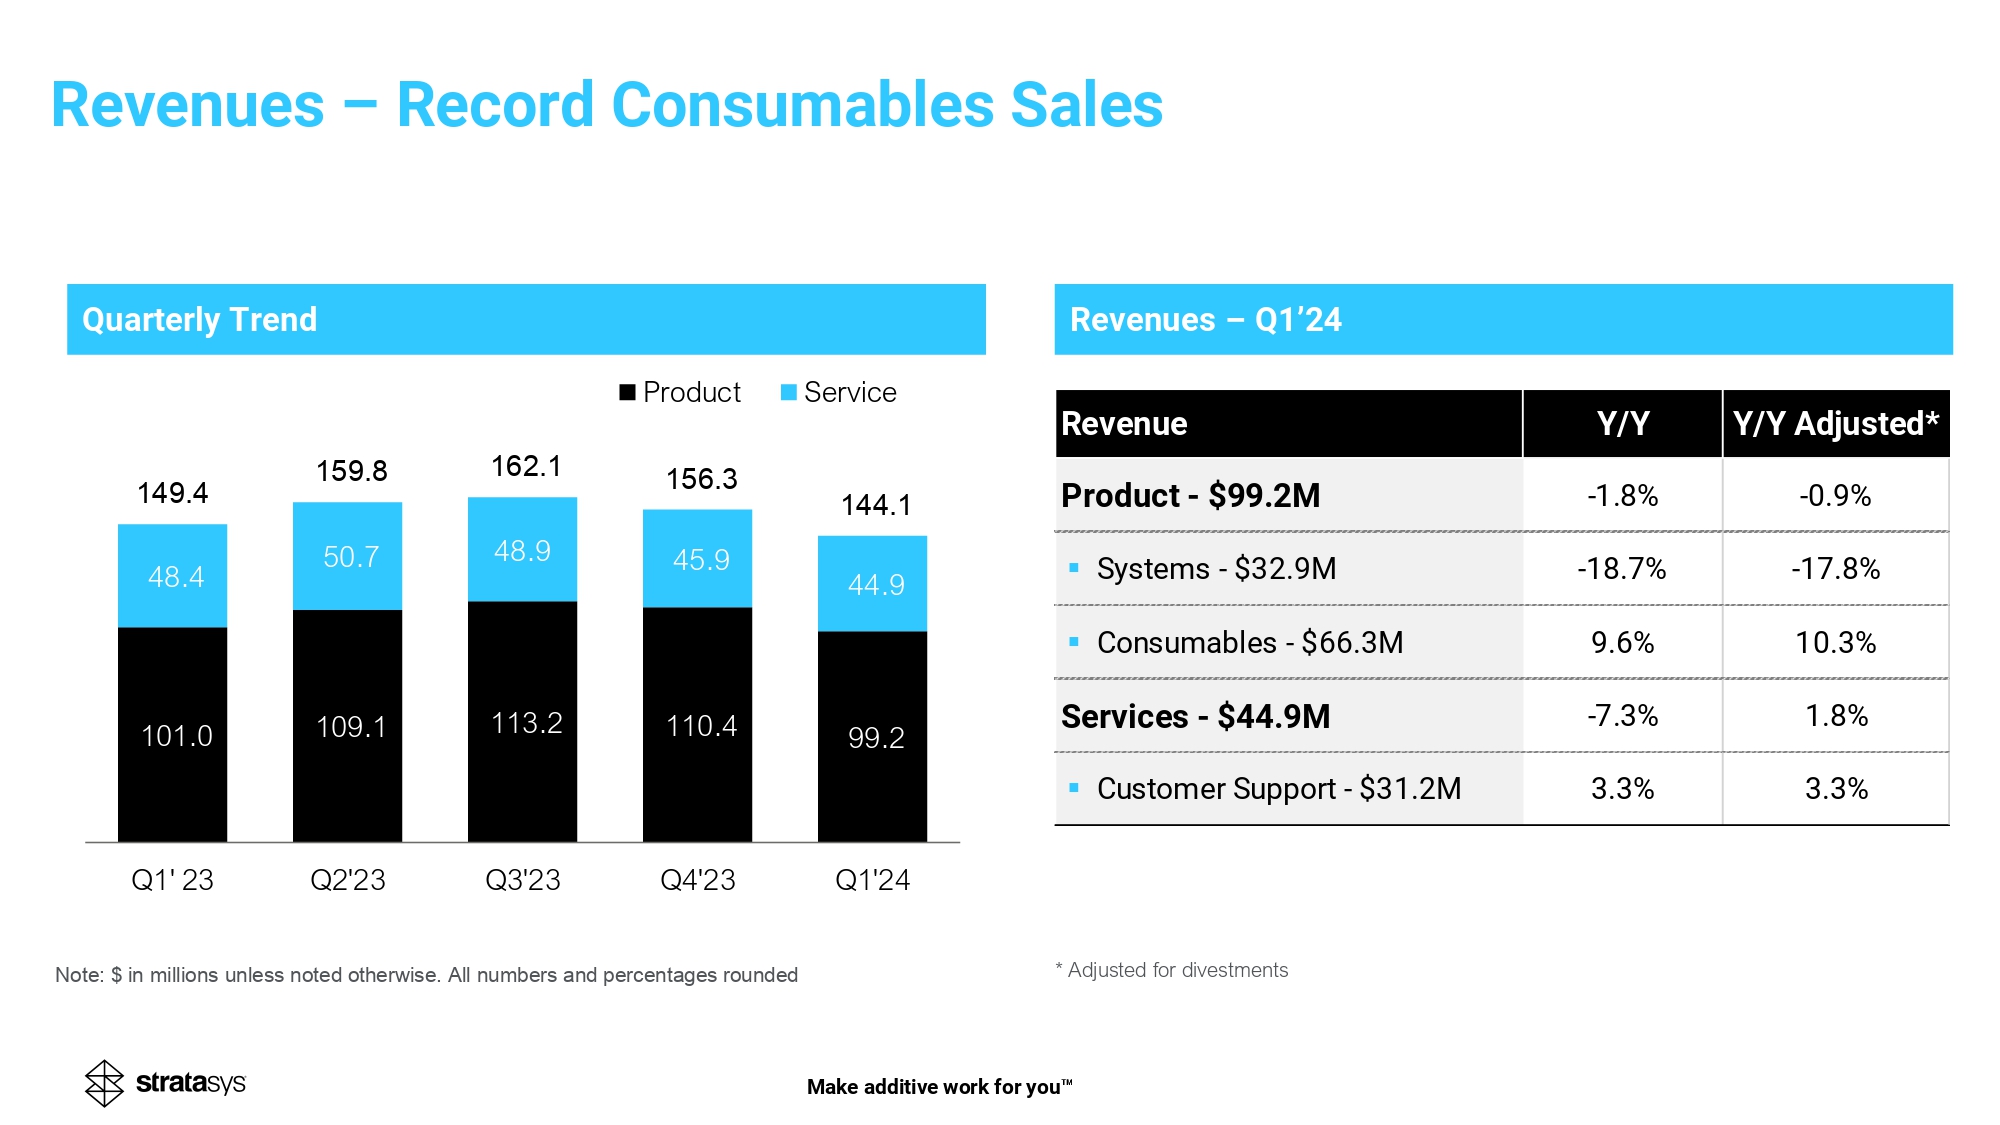
Revenues – Q 1 ’ 2 * Adjusted for divestments Quarterly Trend 101.0 109.1 113.2 110.4 99.2 48.4 50.7 48.9 45.9 44.9 149.4 159.8 162.1 156.3 144.1 Q1' 23 Q2'23 Q3'23 Q4'23 Q1'24 Product Service Note: $ in millions unless noted otherwise. All numbers and percentages rounded Revenue Y/Y Y/Y Adjusted* Product - $99.2M -1.8% -0.9% ▪ Systems - $32.9M -18.7% -17.8% ▪ Consumables - $66.3M 9.6% 10.3% Services - $44.9M -7.3% 1.8% ▪ Customer Support - $31.2M 3.3% 3.3% Make additive work for you Revenues – Record Consumables Sales
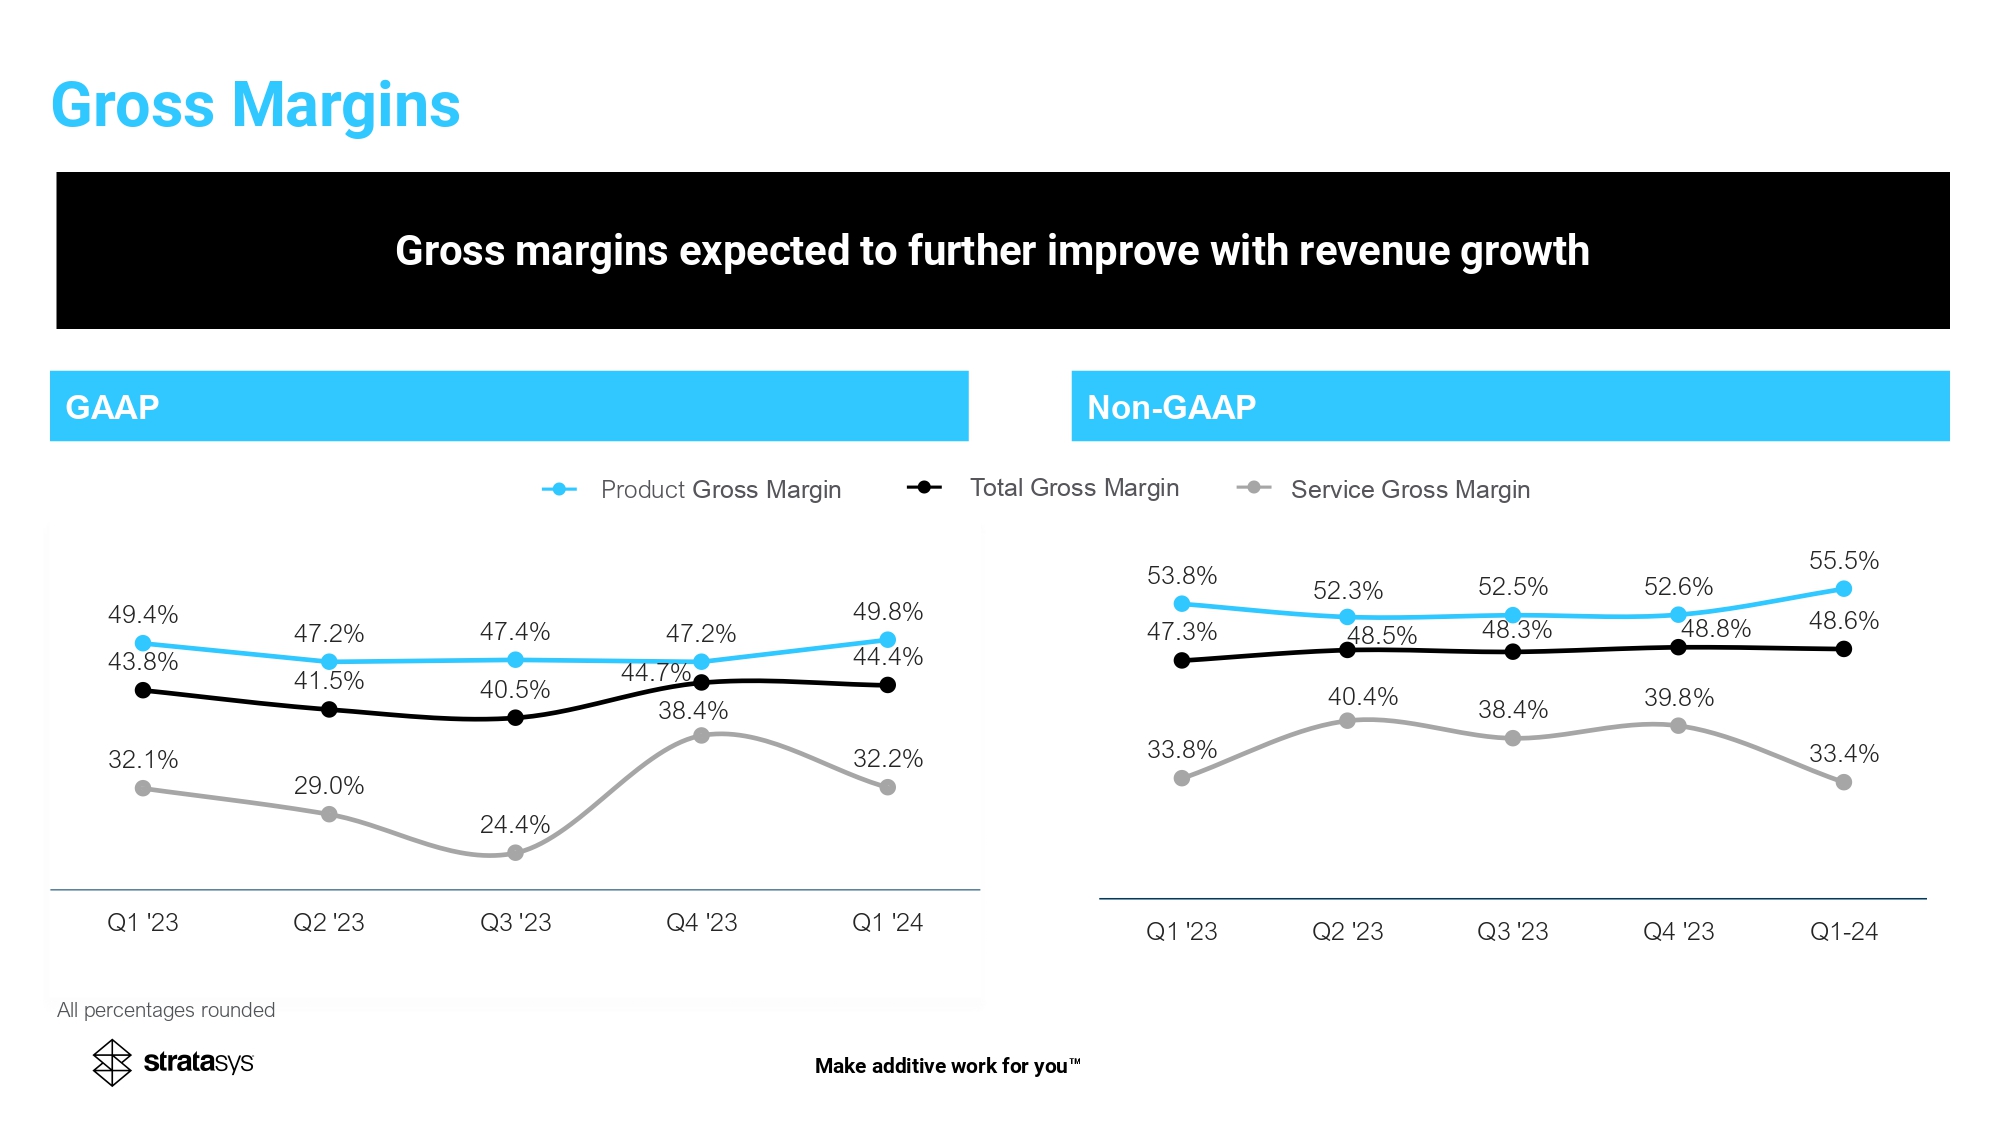
GAAP Non - GAAP 49.4 % 47.2% 47.4 % 47.2% 49.8% 32.1 % 29.0% 24.4% 38.4 % 32.2% 43.8 % 41.5% 40.5% 44.7 % 44.4% Q1 '23 Q2 '23 Q3 '23 Q4 '23 Q1 '24 47.3% 48.5 % 48.3% 48.8 % 48.6% 53.8% 52.3 % 52.5% 52.6% 55.5 % 33.8% 40.4 % 38.4% 39.8% 33.4 % Q1 '23 Q2 '23 Q3 '23 Q4 '23 Q1-24 Service Gross Margin Product Gross Margin Total Gross Margin All percentages rounded Gross margins expected to further improve with revenue growth Gross Margins Make additive work for you

Operating Expenses GAAP operating expenses (absolute and as a percentage of revenues) Non - GAAP operating expenses (absolute and as a percentage of revenues) 82.2 88.4 Q1'23 Q1'24 61.3% 69.2 71.2 Q1'23 Q1'24 49.5% Note: $ in millions unless noted otherwise. All numbers and percentages rounded 55.0% 46.3 % Make additive work for you
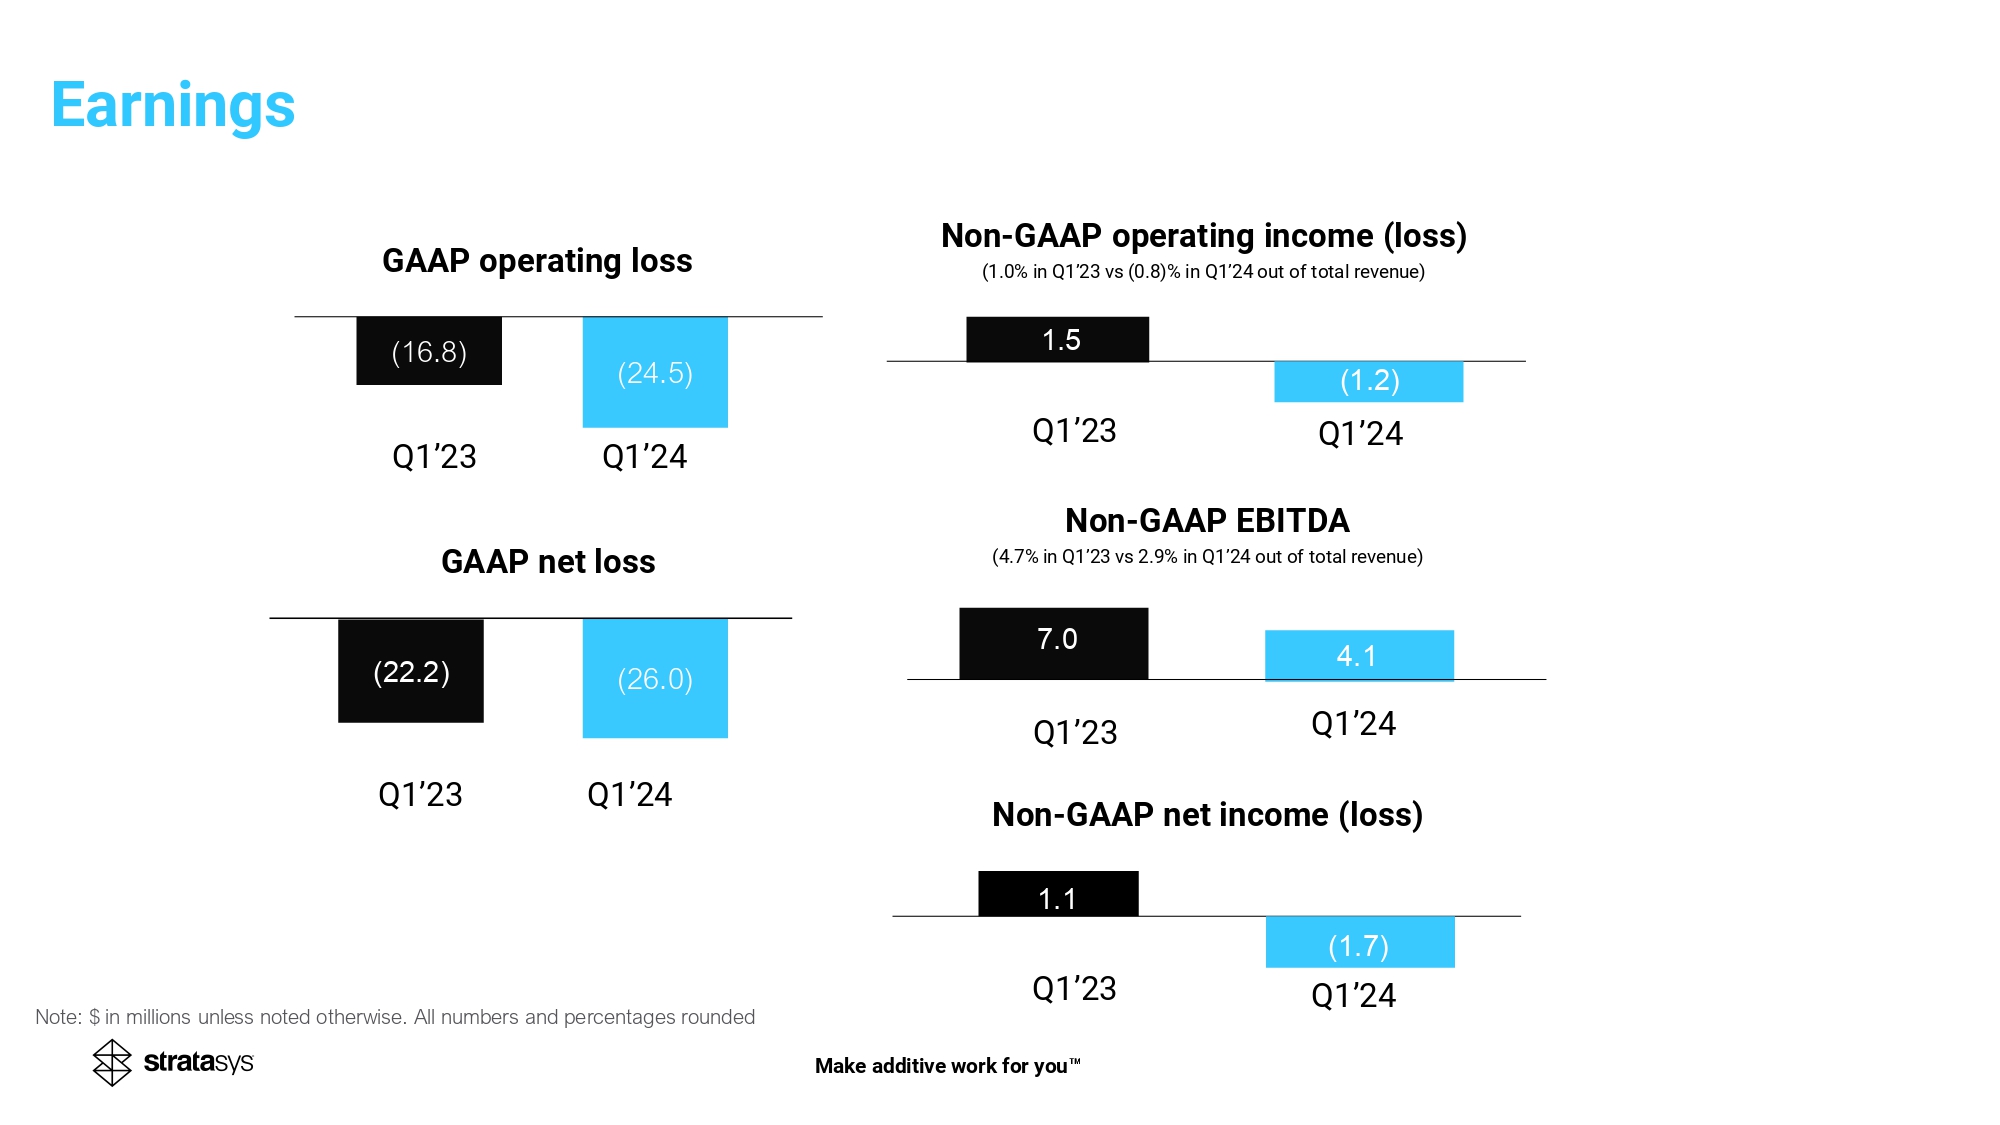
(22.2) (26.0) ( 16.8 ) (24.5) Non - GAAP operating income (loss) ( 1.0 % in Q 1 ’ 23 vs ( 0.8 )% in Q 1 ’ 24 out of total revenue) GAAP operating loss Non - GAAP net income (loss) GAAP net loss Note: $ in millions unless noted otherwise. All numbers and percentages rounded Q1’23 Q 1 ’ 24 4.1 7.0 (1.7) Non - GAAP EBITDA ( 4.7 % in Q 1 ’ 23 vs 2.9 % in Q 1 ’ 24 out of total revenue) 1.5 (1.2) 1.1 Q 1 ’ 23 Q1’24 Q 1 ’ 23 Q1’24 Q 1 ’ 23 Q1’24 Q1’23 Q1’24 Make additive work for you Earnings
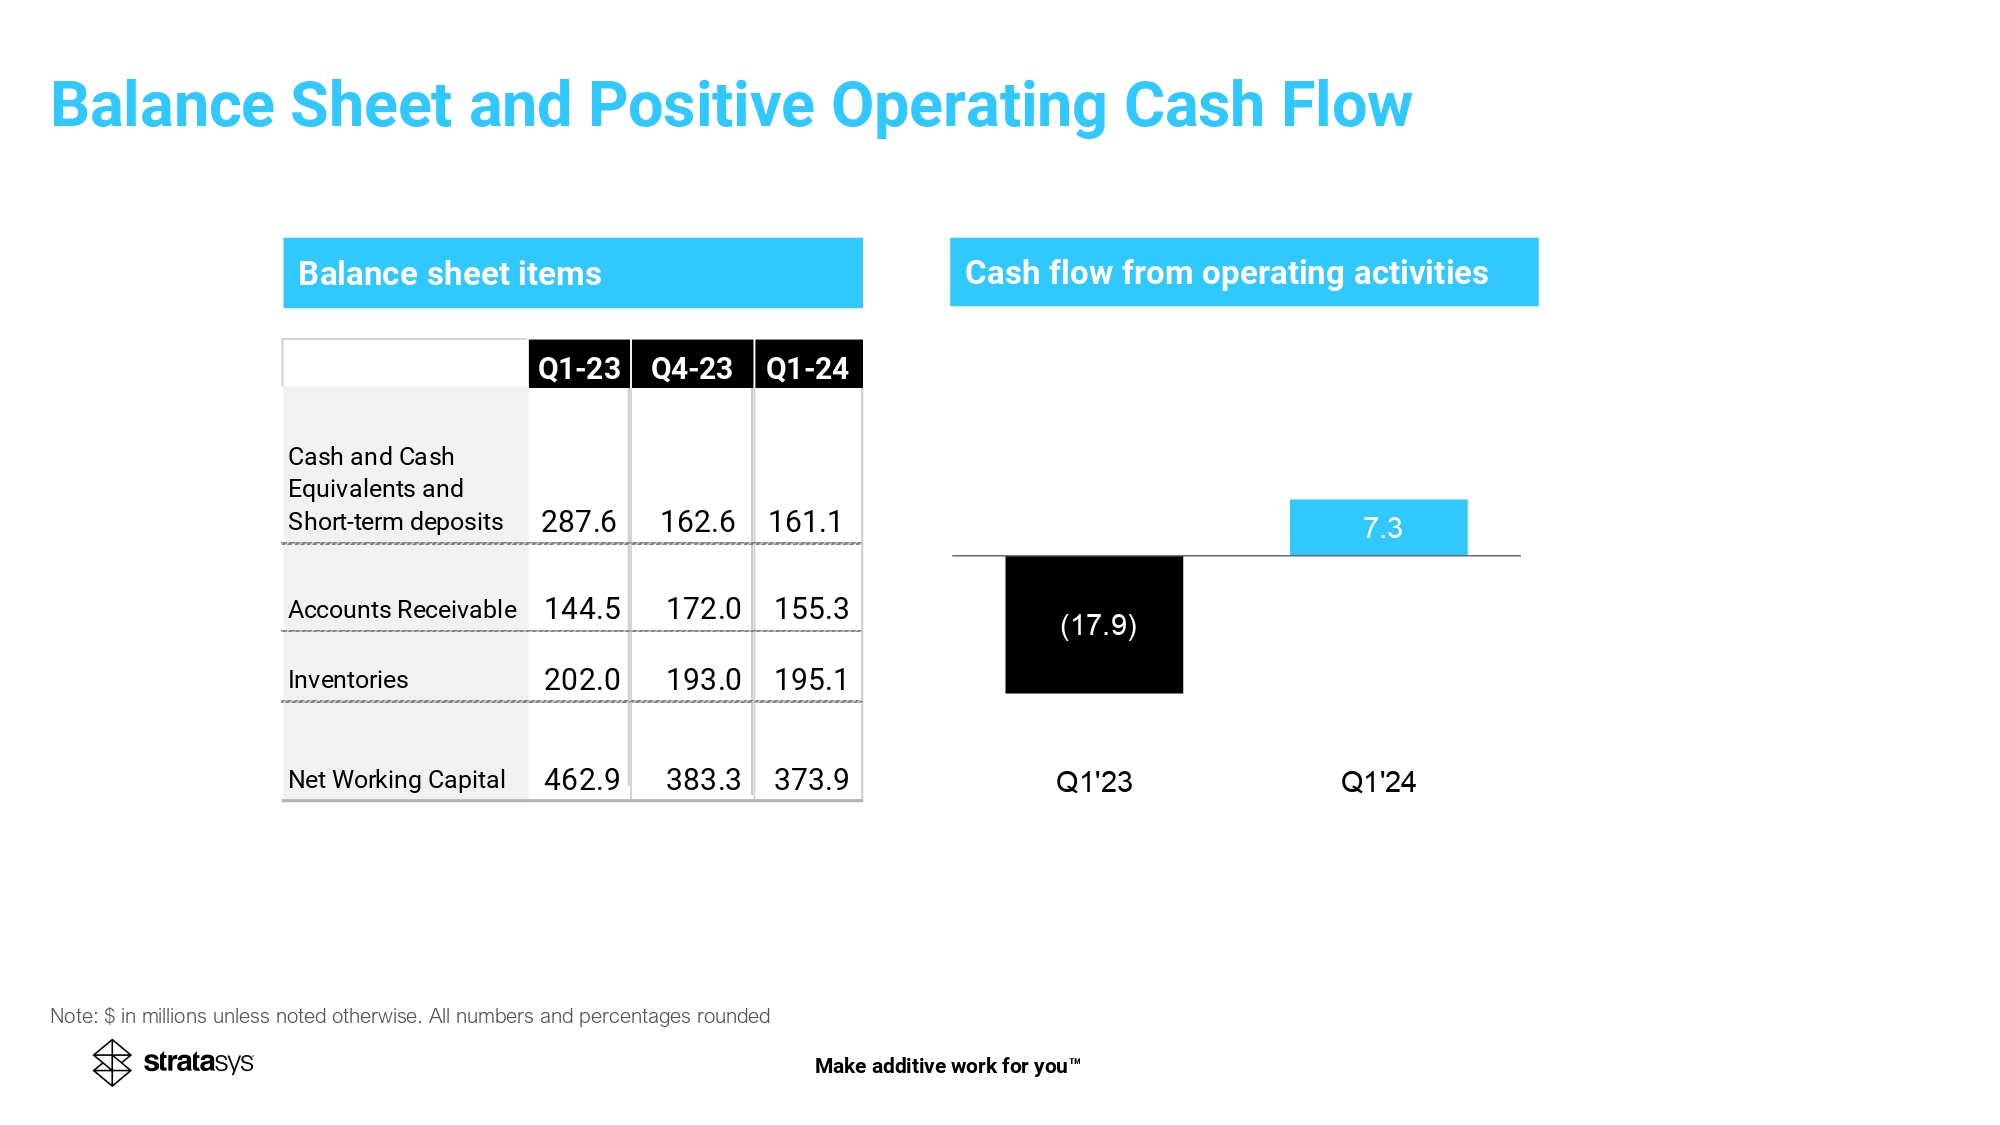
Balance sheet items Cash flow from operating activities 14 Note: $ in millions unless noted otherwise. All numbers and percentages rounded (17.9) 7.3 Q1'23 Q1'24 ( 75.4 ) (62.3) Make additive work for you Balance Sheet and Positive Operating Cash Flow Q1-23 Q4-23 Q1-24 Cash and Cash Equivalents and Short-term deposits 287.6 162.6 161.1 Accounts Receivable 144.5 172.0 155.3 Inventories 202.0 193.0 195.1 Net Working Capital 462.9 383.3 373.9
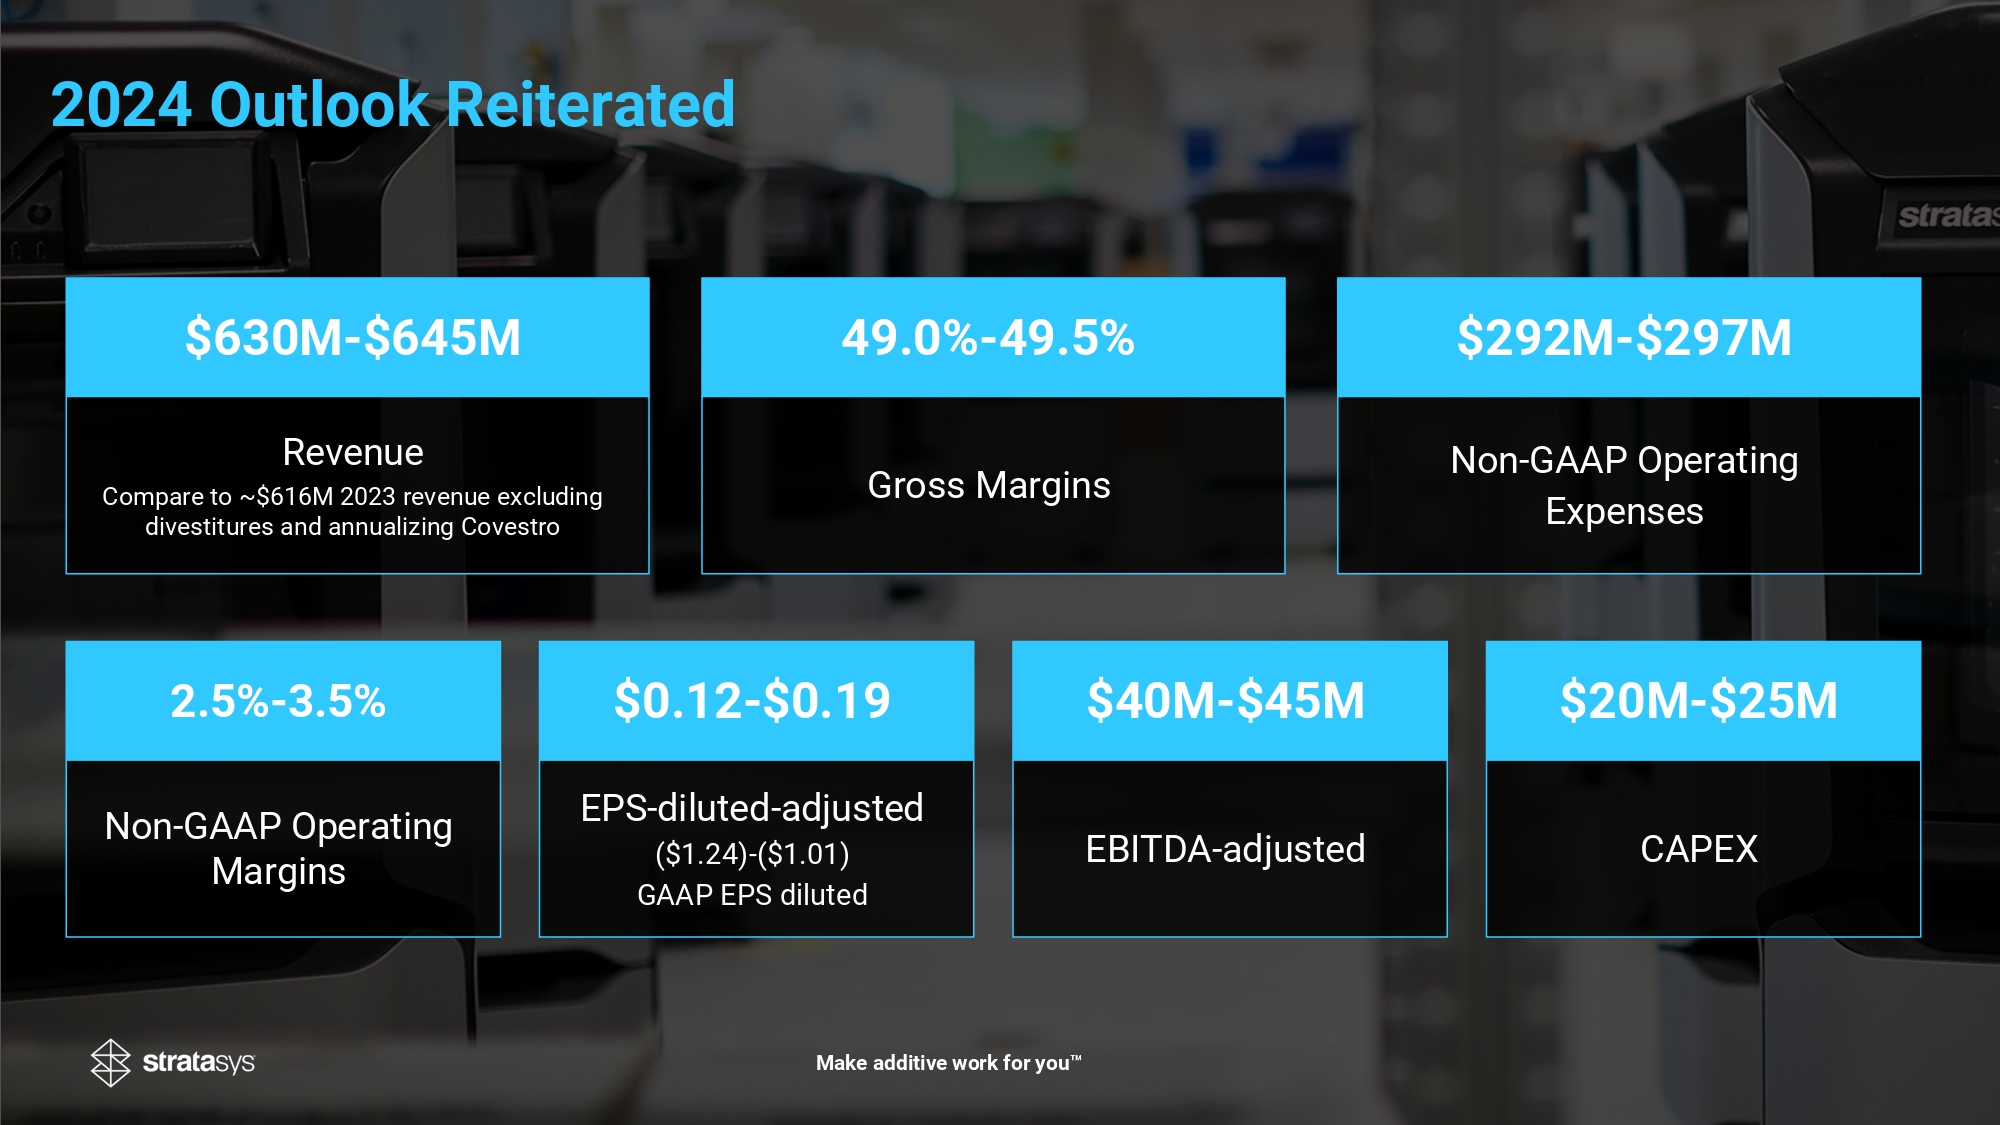
Revenue Compare to ~$616M 2023 revenue excluding divestitures and annualizing Covestro Gross Margins Non - GAAP Operating Expenses Non - GAAP Operating Margins EPS - diluted - adjusted ($ 1.24 ) - ($ 1.01 ) GAAP EPS diluted CAPEX EBITDA - adjusted $ 630 M - $ 645 M 49.0% - 49.5% $292M - $297M 2.5 % - 3.5 % $0.12 - $ 0.19 $ 20 M - $ 25 M $40M - $45M Make additive work for you 2024 Outlook Reiterated
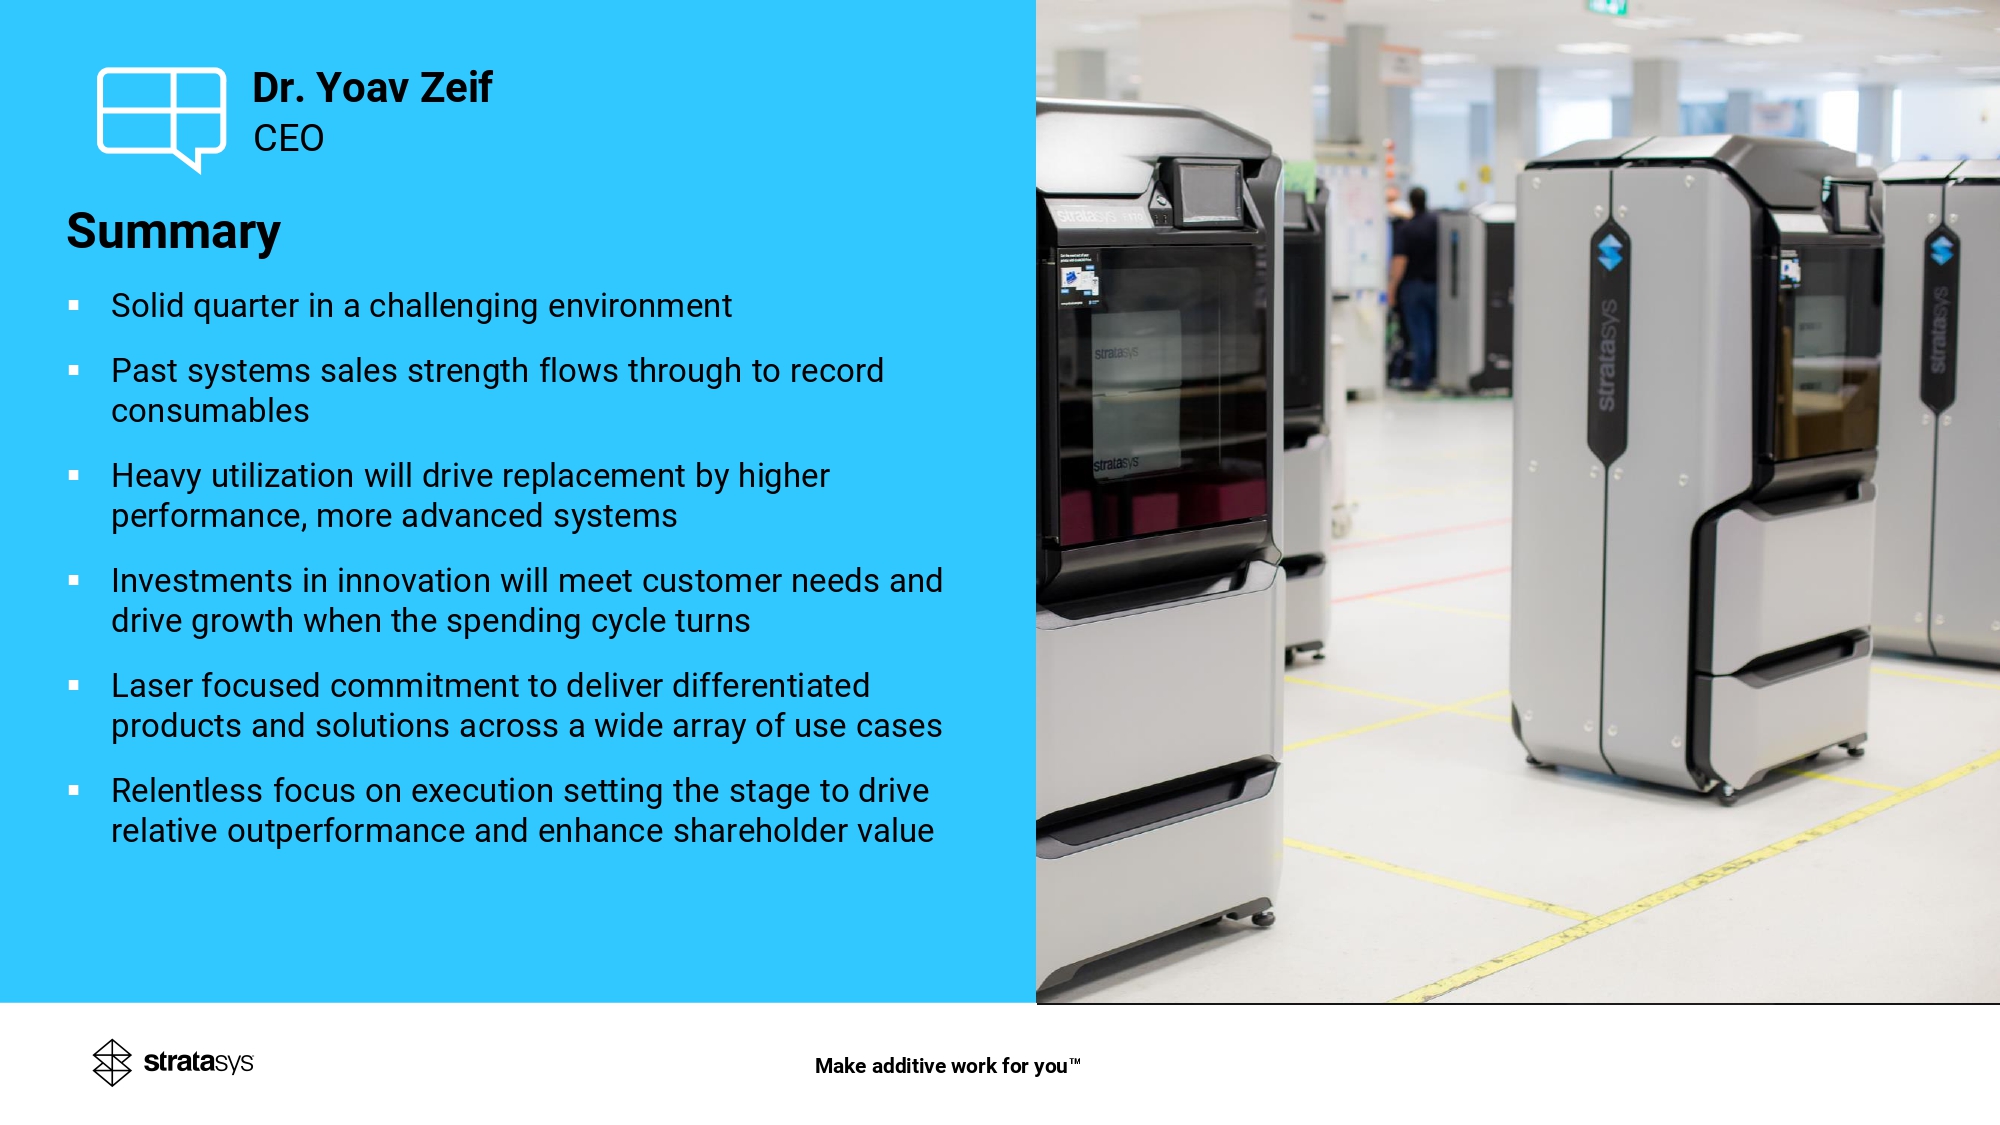
CEO Dr. Yoav Zeif Summary ▪ Solid quarter in a challenging environment ▪ Past systems sales strength flows through to record consumables ▪ Heavy utilization will drive replacement by higher performance, more advanced systems ▪ Investments in innovation will meet customer needs and drive growth when the spending cycle turns ▪ Laser focused commitment to deliver differentiated products and solutions across a wide array of use cases ▪ Relentless focus on execution setting the stage to drive relative outperformance and enhance shareholder value Make additive work for you
THANK YOU. Make additive work for you
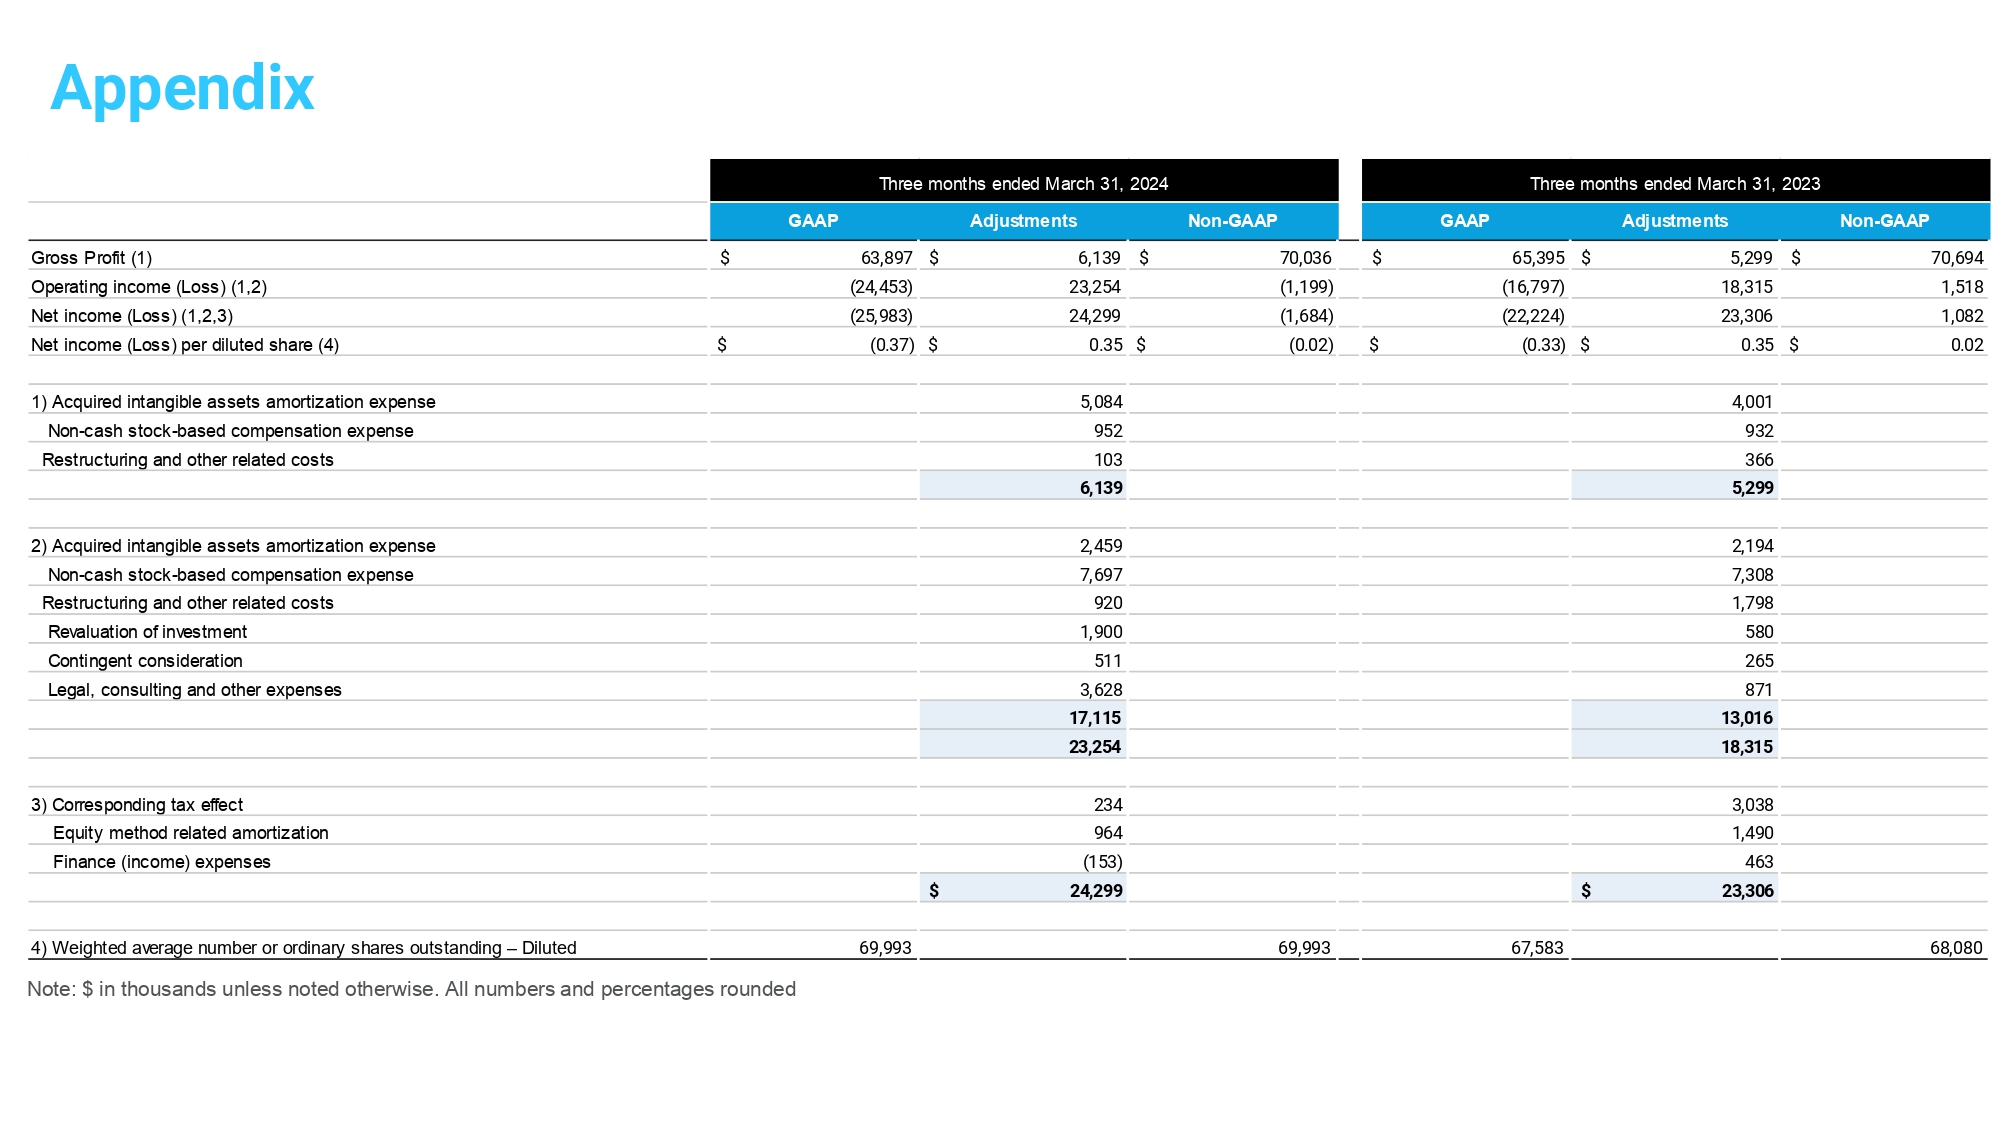
Appendix Note: $ in thousands unless noted otherwise. All numbers and percentages rounded GAAP Adjustments Non-GAAP GAAP Adjustments Non-GAAP Gross Profit (1) $ 63,897 $ 6,139 $ 70,036 $ 65,395 $ 5,299 $ 70,694 Operating income (Loss) (1,2) (24,453) 23,254 (1,199) (16,797) 18,315 1,518 Net income (Loss) (1,2,3) (25,983) 24,299 (1,684) (22,224) 23,306 1,082 Net income (Loss) per diluted share (4) $ (0.37) $ 0.35 $ (0.02) $ (0.33) $ 0.35 $ 0.02 1) Acquired intangible assets amortization expense 5,084 4,001 Non-cash stock-based compensation expense 952 932 Restructuring and other related costs 103 366 6,139 5,299 2) Acquired intangible assets amortization expense 2,459 2,194 Non-cash stock-based compensation expense 7,697 7,308 Restructuring and other related costs 920 1,798 Revaluation of investment 1,900 580 Contingent consideration 511 265 Legal, consulting and other expenses 3,628 871 17,115 13,016 23,254 18,315 3) Corresponding tax effect 234 3,038 Equity method related amortization 964 1,490 Finance (income) expenses (153) 463 $ 24,299 $ 23,306 4) Weighted average number or ordinary shares outstanding – Diluted 69,993 69,993 67,583 68,080 Three months ended March 31, 2024 Three months ended March 31, 2023