Exhibit 99.2
Make additive work for you Q4 and FY 2023 Results Speakers Dr. Yoav Zeif, CEO Eitan Zamir, CFO Yonah Lloyd, CCO & VP IR March 7, 2024

Conference Call and Webcast Details US Toll - Free Dial - In 1 - 877 - 407 - 0619 International Dial - In 1 - 412 - 902 - 1012 Live Webcast and Replay https://event.choruscall.com/mediaframe/ webcast.html?webcastid=cZzaGlQr Make additive work for you

Forward - Looking Statements Cautionary Statement Regarding Forward - Looking Statements The statements in this slide presentation regarding Stratasys' strategy, and the statements regarding its projected future financial performance, including the financial guidance concerning its expected results for 2024, are forward - looking statements reflecting management's current expectations and beliefs. These forward - looking statements are based on current information that is, by its nature, subject to rapid and even abrupt change. Due to risks and uncertainties associated with Stratasys' business, actual results could differ materially from those projected or implied by these forward - looking statements. These risks and uncertainties include, but are not limited to: the degree of our success at introducing new or improved products and solutions that gain market share; the extent of growth of the 3D printing market generally; global macro - economic trends that have been adversely affecting, and may continue to adversely affect, our results, including inflationary pressures and higher interest rates that reduce capital expenditures; the impact of potential shifts in the prices or margins of the products that we sell or services that we provide, including due to a shift towards lower margin products or services; the impact of competition and new technologies; the outcome of our board’s comprehensive process to explore strategic alternatives for our company; potential further charges against earnings that we could be required to take due to impairment of additional goodwill or other intangible assets that we have recently acquired or may acquire in the future; the extent of our success at successfully integrating into our existing business, or making additional, acquisitions or investments in new businesses, technologies, products or services ; potential adverse impact that recent global interruptions involving freight carriers and other third parties may have on our supply chain and distribution network; potential changes in our management and board of directors; global market, political and economic conditions, in the countries in which we operate in particular (including risks stemming from Russia’s invasion of Ukraine); the degree of impact of I srael’s war against the terrorist organization Hamas, given our Israeli headquarters, factories and significant operations; costs and potential liability relating to litigation and regulatory proceedings; risks related to infringement of our intellectual property rights by others or infringement of others' intellectual property rights by us; potential cyber attacks against, or other breaches to, our information technologies systems; the extent of our success at maintaining our liquidity and financing our operations and capital needs; the impact of tax regulations on our results of operations and financial condition; and those additional factors referred to in Item 3.D “Key Information - Risk Factors”, Item 4, “Information on the Company”, Item 5, “Operating and Financial Review and Prospects,” and all other parts of our Annual Report on Form 20 - F for the year ended December 31, 2023, to be filed with the SEC in early March 2024 (the “2023 Annual Report”). Readers are urged to carefully review and consider the various disclosures made throughout our 2023 Annual Report (once it is filed) and the Reports of Foreign Private Issuer on Form 6 - K that will attach Stratasys’ unaudited, condensed consolidated financial statements and its review of its results of operations and financial condition on a quarterly basis, which Stratasys will furnish to the SEC throughout 2024, and our other reports filed with or furnished to the SEC, which are designed to advise interested parties of the risks and factors that may affect our business, financial condition, results of operations and prospects. Any guidance provided, and other forward - looking statements made, in this slide presentation are made as of the date hereof, and Stratasys undertakes no obligation to publicly update or revise any forward - looking statements, whether as a result of new information, future events or otherwise, except as required by law. Make additive work for you
Use of Non - GAAP Financial Information Use of Non - GAAP Financial Measures The non - GAAP data included herein, which excludes certain items as described below, are non - GAAP financial measures. Our management believes that these non - GAAP financial measures are useful information for investors and shareholders of our Company in gauging our results of operations ( i ) on an ongoing basis after excluding mergers, acquisitions and divestments related expense or gains and reorganization - related charges or gains, legal provisions, and (ii) excluding non - cash items such as stock - based compensation expenses, acquired intangible assets amortization, including intangible assets amortization related to equity method investments, impairment of long - lived assets and goodwill, revaluation of our investments and the corresponding tax effect of those items. The items eliminated via these non - GAAP adjustments either do not reflect actual cash outlays that impact our liquidity and our financial condition or have a non - recurring impact on the statement of operations, as assessed by management. These non - GAAP financial measures are presented to permit investors to more fully understand how management assesses our performance for internal planning and forecasting purposes. The limitations of using these non - GAAP financial measures as performance measures are that they provide a view of our results of operations without including all items indicated above during a period, which may not provide a comparable view of our performance to other companies in our industry. Investors and other readers should consider non - GAAP measures only as supplements to, not as substitutes for or as superior measures to, the measures of financial performance prepared in accordance with GAAP. Reconciliation between results on a GAAP and non - GAAP basis is provided in a table later in this slide presentation. Make additive work for you
CEO Dr. Yoav Zeif ▪ Profitable results in a CapEx - constrained environment ▪ Another record Consumables quarter, testament to strong usage ▪ Tenth consecutive quarter of adjusted profitability reflects business model discipline that differentiates Stratasys ▪ Laying foundation for meaningful use - cases that will significantly contribute to financial performance. ▪ Best - in - class technologies increasingly broaden MFG applications ▪ Pent - up demand to re - accelerate growth as macro environment improves and CapEx patterns normalize ▪ 2023 revenues up 1.3% YoY after backing out divestitures ▪ 2023 GM improvement reflects cost - control and efficiency focus ▪ Healthy balance sheet to support our growth ▪ 2023 revenues from MFG was 34%, up from 32.5% in 2022 We expect this to grow stronger as macro conditions improve - majority of our business will eventually come from MFG Make additive work for you
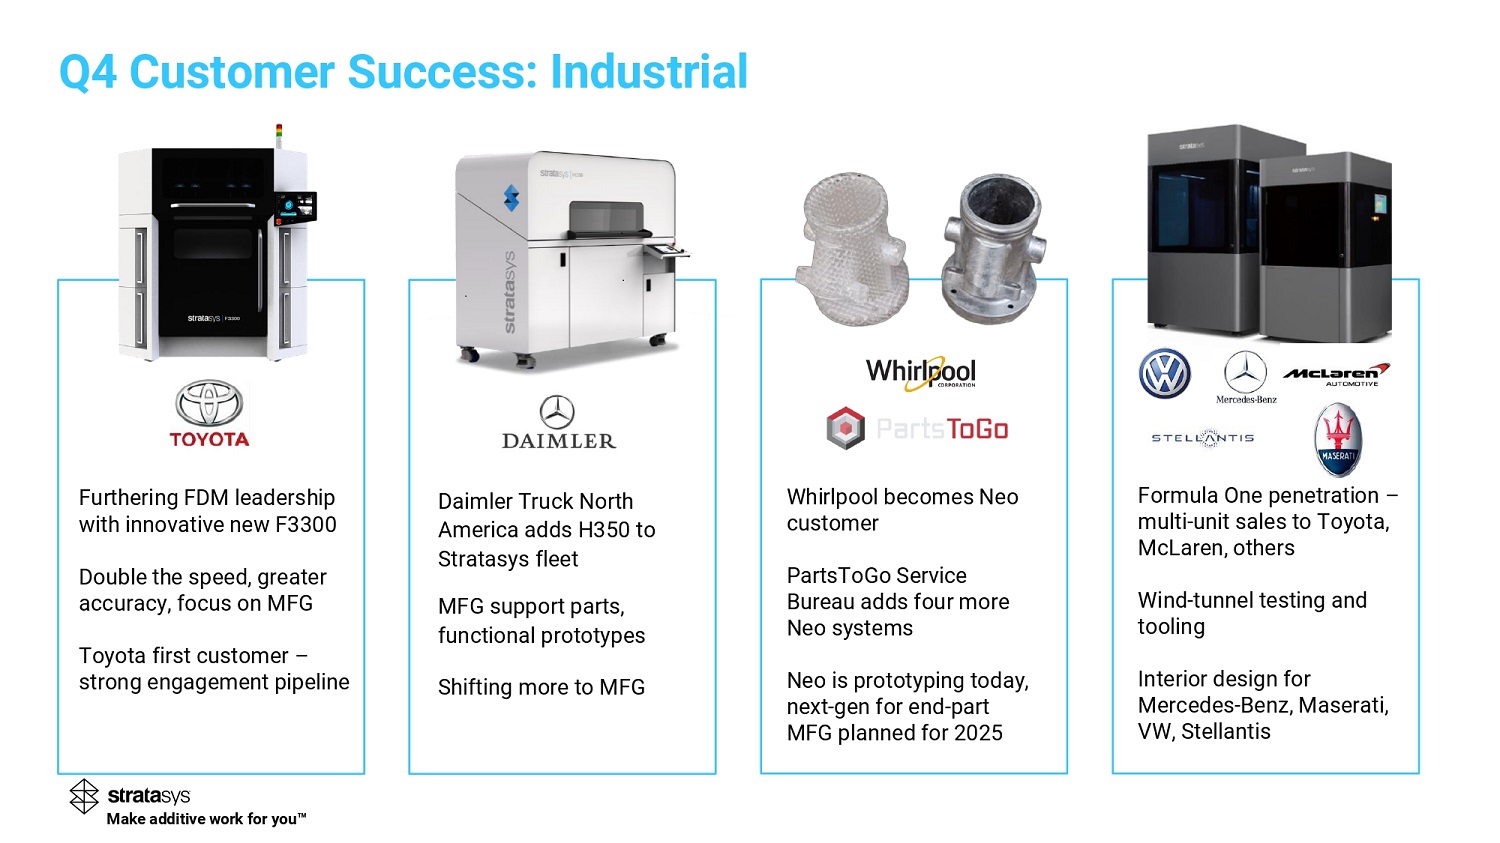
Daimler Truck North America adds H 350 to Stratasys fleet MFG support parts, functional prototypes Shifting more to MFG Furthering FDM leadership with innovative new F 3300 Double the speed, greater accuracy, focus on MFG Toyota first customer – strong engagement pipeline Q4 Customer Success: Industrial Whirlpool becomes Neo customer PartsToGo Service Bureau adds four more Neo systems Neo is prototyping today, next - gen for end - part MFG planned for 2025 Formula One penetration – multi - unit sales to Toyota, McLaren, others Wind - tunnel testing and tooling Interior design for Mercedes - Benz, Maserati, VW, Stellantis Make additive work for you
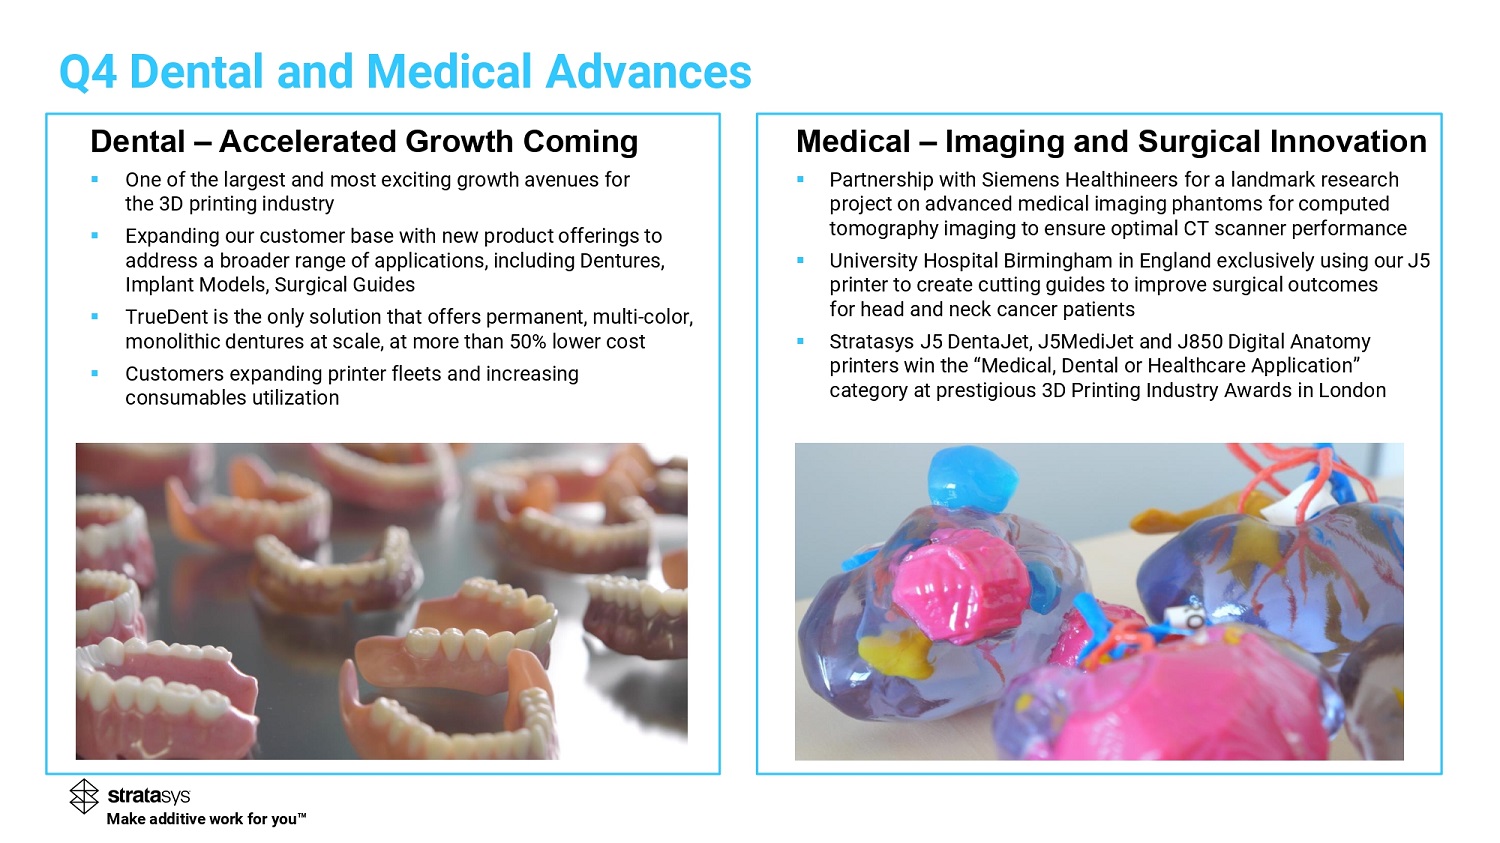
Dental – Accelerated Growth Coming ▪ One of the largest and most exciting growth avenues for the 3D printing industry ▪ Expanding our customer base with new product offerings to address a broader range of applications, including Dentures, Implant Models, Surgical Guides ▪ TrueDent is the only solution that offers permanent, multi - color, monolithic dentures at scale, at more than 50% lower cost ▪ Customers expanding printer fleets and increasing consumables utilization Medical – Imaging and Surgical Innovation ▪ Partnership with Siemens Healthineers for a landmark research project on advanced medical imaging phantoms for computed tomography imaging to ensure optimal CT scanner performance ▪ University Hospital Birmingham in England exclusively using our J5 printer to create cutting guides to improve surgical outcomes for head and neck cancer patients ▪ Stratasys J5 DentaJet, J5MediJet and J850 Digital Anatomy printers win the “Medical, Dental or Healthcare Application” category at prestigious 3D Printing Industry Awards in London Q 4 Dental and Medical Advances Make additive work for you
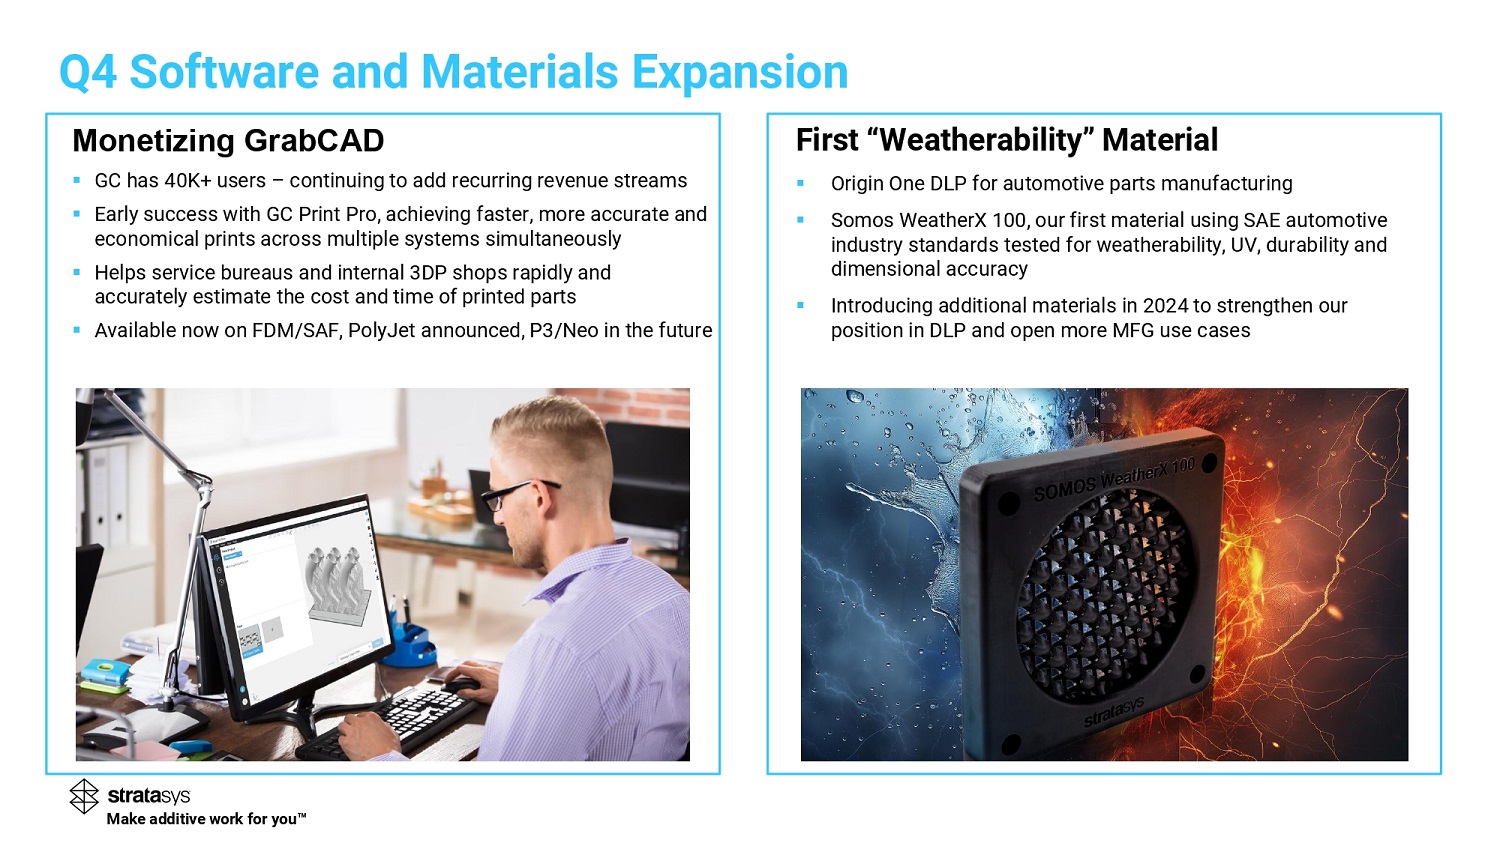
Monetizing GrabCAD ▪ GC has 40K+ users – continuing to add recurring revenue streams ▪ Early success with GC Print Pro, achieving faster, more accurate and economical prints across multiple systems simultaneously ▪ Helps service bureaus and internal 3DP shops rapidly and accurately estimate the cost and time of printed parts ▪ Available now on FDM/SAF, PolyJet announced, P3/Neo in the future First “Weatherability” Material ▪ Origin One DLP for automotive parts manufacturing ▪ Somos WeatherX 100, our first material using SAE automotive industry standards tested for weatherability, UV, durability and dimensional accuracy ▪ Introducing additional materials in 2024 to strengthen our position in DLP and open more MFG use cases Q4 Software and Materials Expansion Make additive work for you
CFO Eitan Zamir CFO Remarks ▪ Achieved solid results in the fourth quarter against what has continued to be a challenging backdrop of adverse macroeconomic factors and related pressures ▪ Confident that the high level of demand we are seeing in our customer engagements will translate into meaningful growth once these headwinds abate ▪ Results demonstrate the resilience our diversified offering provides, which led to our tenth consecutive quarter of profitability Make additive work for you
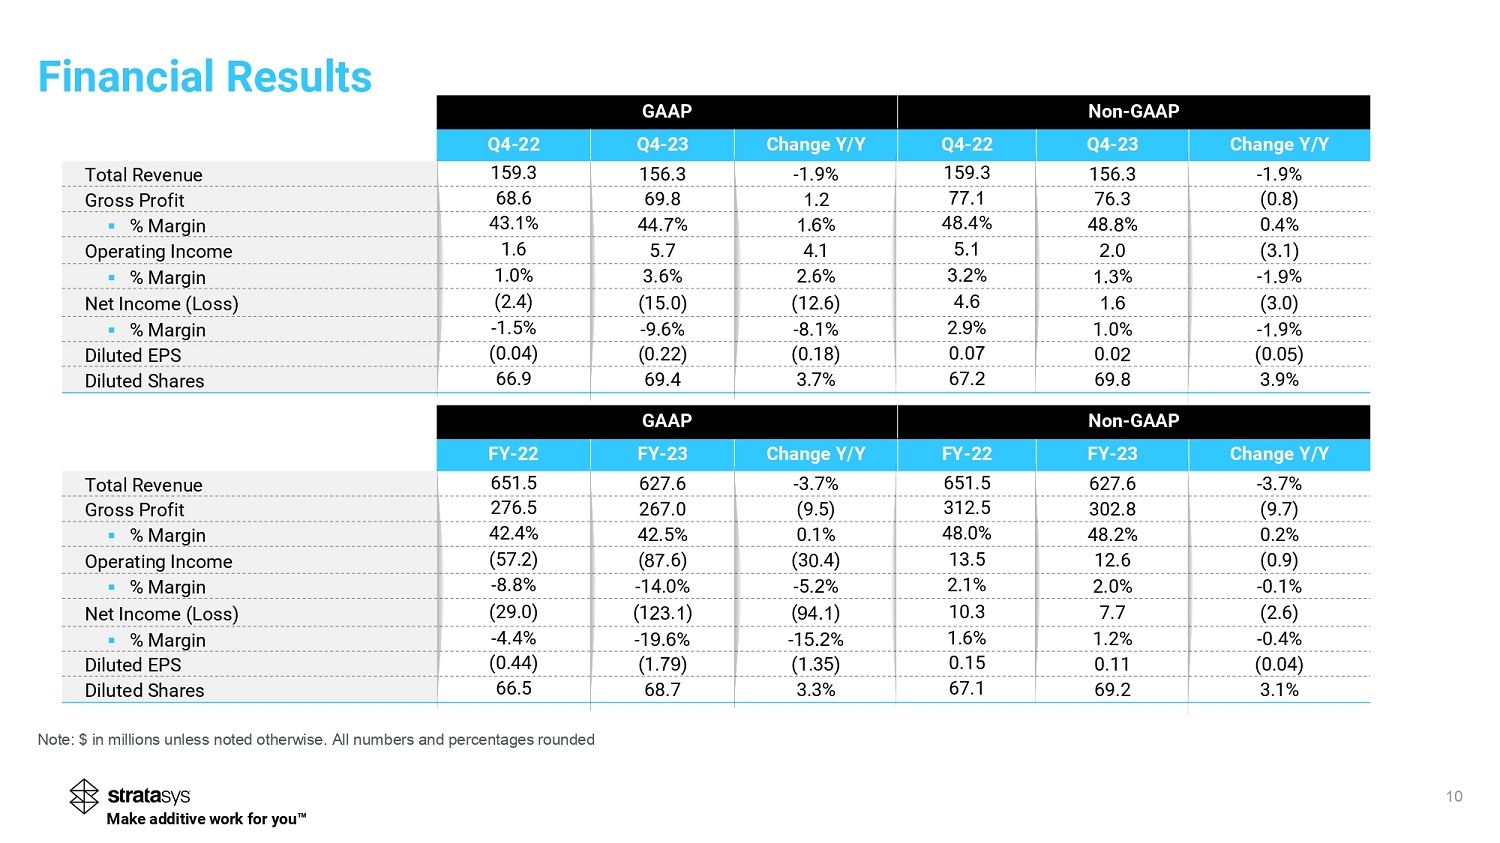
10 Non - GAAP GAAP Change Y/Y Q4 - 23 Q4 - 22 Change Y/Y Q4 - 23 Q4 - 22 - 1.9% 156.3 159.3 - 1.9% 156.3 159.3 Total Revenue (0.8) 76.3 2 69.8 68.6 Gross Profit 0. % 48. % % . % 4 . % 43. % ▪ % Margin ( 1 ) 4.1 5.7 1.6 Operating Income - % % % 2.6% 3.6% 1.0% ▪ % Margin (3.0) (12.6) (15.0) (2.4) Net Income (Loss) - 9 % 1.0% 2. % - 8.1% - 9.6% - 1.5% ▪ % Margin ( 0.0 ) 0.0 0.0 (0.18) (0.22) (0.04) Diluted EPS 3.9% 69.8 67. 3.7% 69.4 6 6.9 Diluted Shares Note: $ in millions unless noted otherwise. All numbers and percentages rounded Financial Results Make additive work for you Non - GAAP GAAP Change Y/Y FY - 23 FY - 22 Change Y/Y FY - 23 FY - 22 - 3.7% 627.6 651.5 - 3.7% 627.6 651.5 Total Revenue (9.7) 302.8 312.5 (9.5) 267.0 276.5 Gross Profit 0.2% 48.2% 48.0% 0.1% 42.5% 42.4% ▪ % Margin (0.9) 12.6 13.5 ( 3 .4 ) ( .6 ) (57.2) Operating Income - 0.1% 2.0% 2.1% - 5. % - 14. % - 8.8% ▪ % Margin (2.6) 7.7 10.3 ( ) ( 1 . ) (29.0) Net Income (Loss) - 0.4% 1.2% 1.6% - 1 % - 1 % - 4.4% ▪ % Margin (0.04) 0.11 0.15 ( 1. ) ( 1. ) (0.44) Diluted EPS 3.1% 69.2 67.1 3.3% 68.7 66.5 Diluted Shares
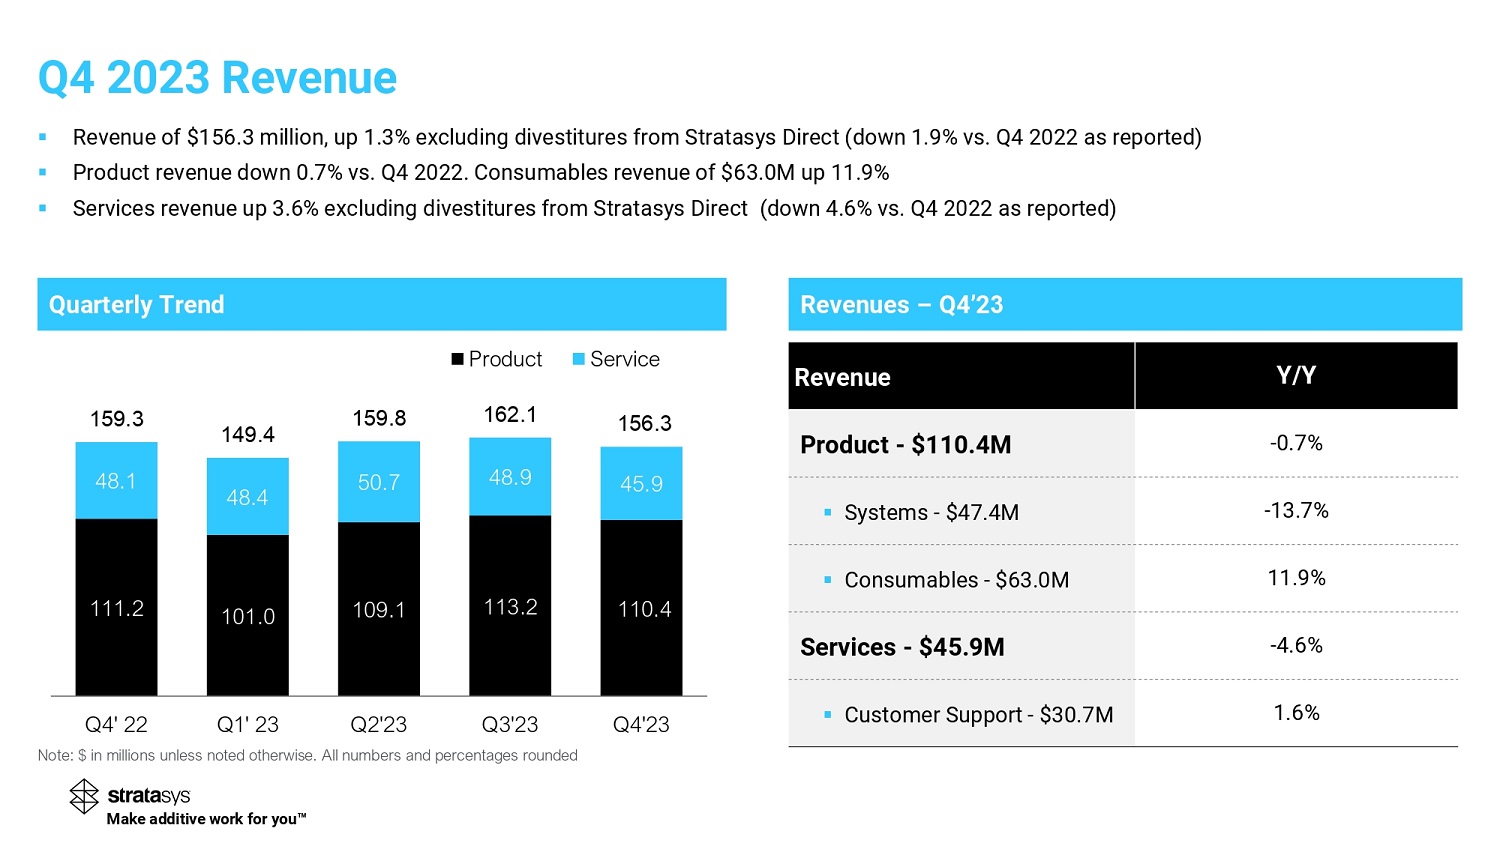
Note: $ in millions unless noted otherwise. All numbers and percentages rounded Quarterly Trend Revenues – Q 4 ’ 2 111.2 101.0 109.1 113.2 110.4 48.1 48.4 50.7 48.9 45.9 159.3 149.4 159.8 162.1 156.3 Q4' 22 Q1' 23 Q2'23 Q3'23 Q4'23 Product Service Y/Y Revenue - 0.7 % Product - $110.4M - 13.7 % ▪ Systems - $47.4M 11.9% ▪ Consumables - $63.0M - 4.6% Services - $45.9M 1.6% ▪ Customer Support - $30.7M Q 4 2023 Revenue ▪ Revenue of $ 156.3 million, up 1.3 % excluding divestitures from Stratasys Direct ( down 1.9 % vs. Q 4 2022 as reported) ▪ Product revenue down 0.7 % vs. Q 4 2022 . Consumables revenue of $ 63.0 M up 11.9 % ▪ Services revenue up 3.6 % excluding divestitures from Stratasys Direct ( down 4.6 % vs. Q 4 2022 as reported) Make additive work for you
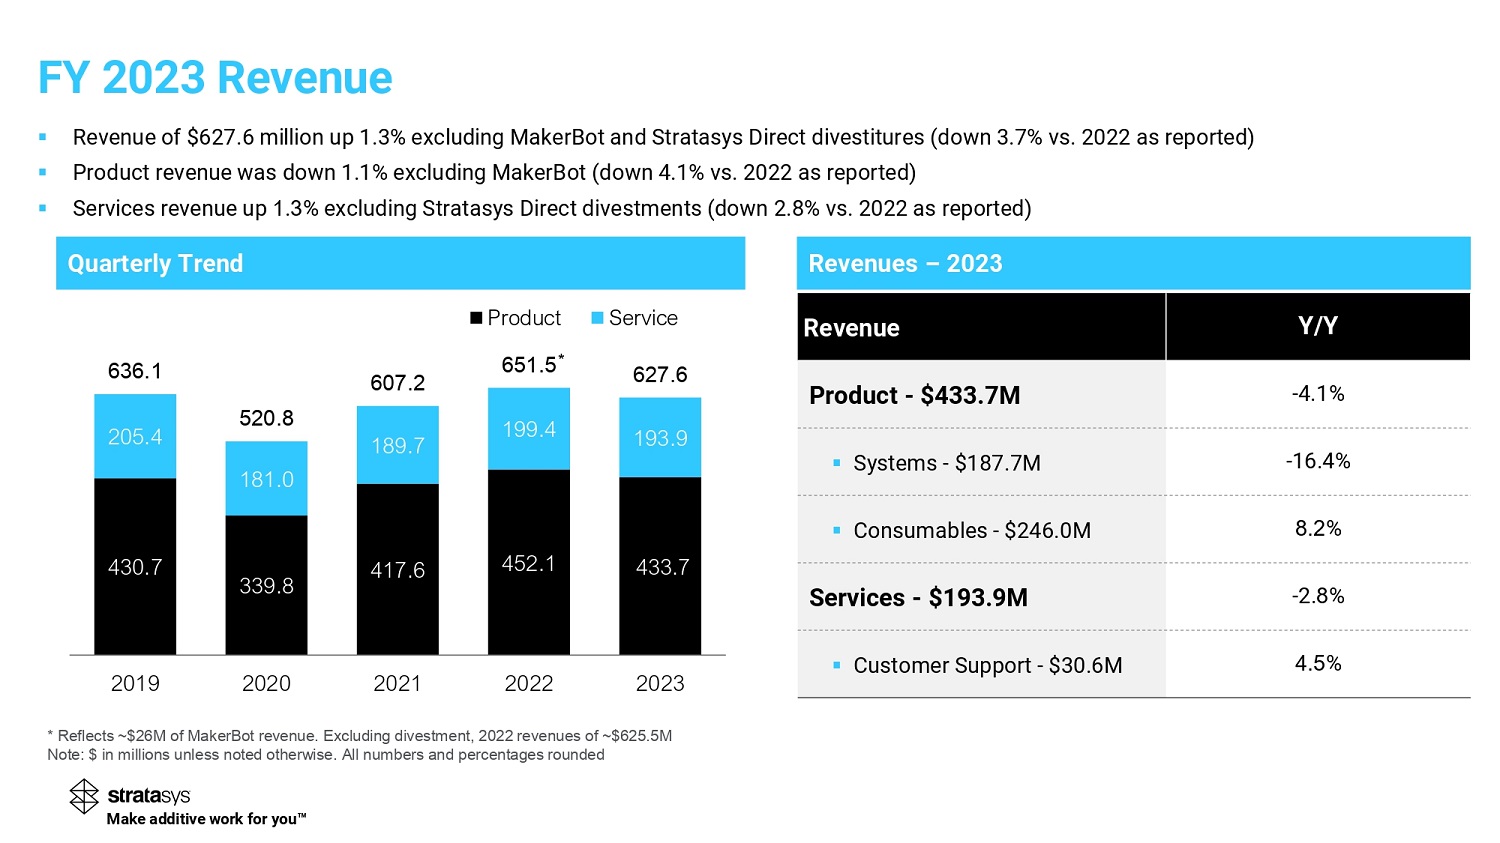
Revenues – 202 Y/Y Revenue - 4.1 % Product - $433.7M - 16.4 % ▪ Systems - $187.7M % ▪ Consumables - $246.0M - 2. % Services - $193.9M % ▪ Customer Support - $30.6M FY 2023 Revenue Make additive work for you ▪ Revenue of $ 627.6 million up 1.3 % excluding MakerBot and Stratasys Direct divestitures ( down 3.7 % vs. 2022 as reported) ▪ Product revenue was down 1.1 % excluding MakerBot ( down 4.1 % vs. 2022 as reported) ▪ Services revenue up . % excluding Stratasys Direct divestments (down 2.8 % vs. 2022 as reported) Quarterly Trend 430.7 339.8 417.6 452.1 433.7 205.4 181.0 189.7 199.4 193.9 636.1 520.8 607.2 651.5 627.6 2019 2020 2021 2022 2023 Product Service * Reflects ~$26M of MakerBot revenue. Excluding divestment, 2022 revenues of ~$625.5M Note: $ in millions unless noted otherwise. All numbers and percentages rounded
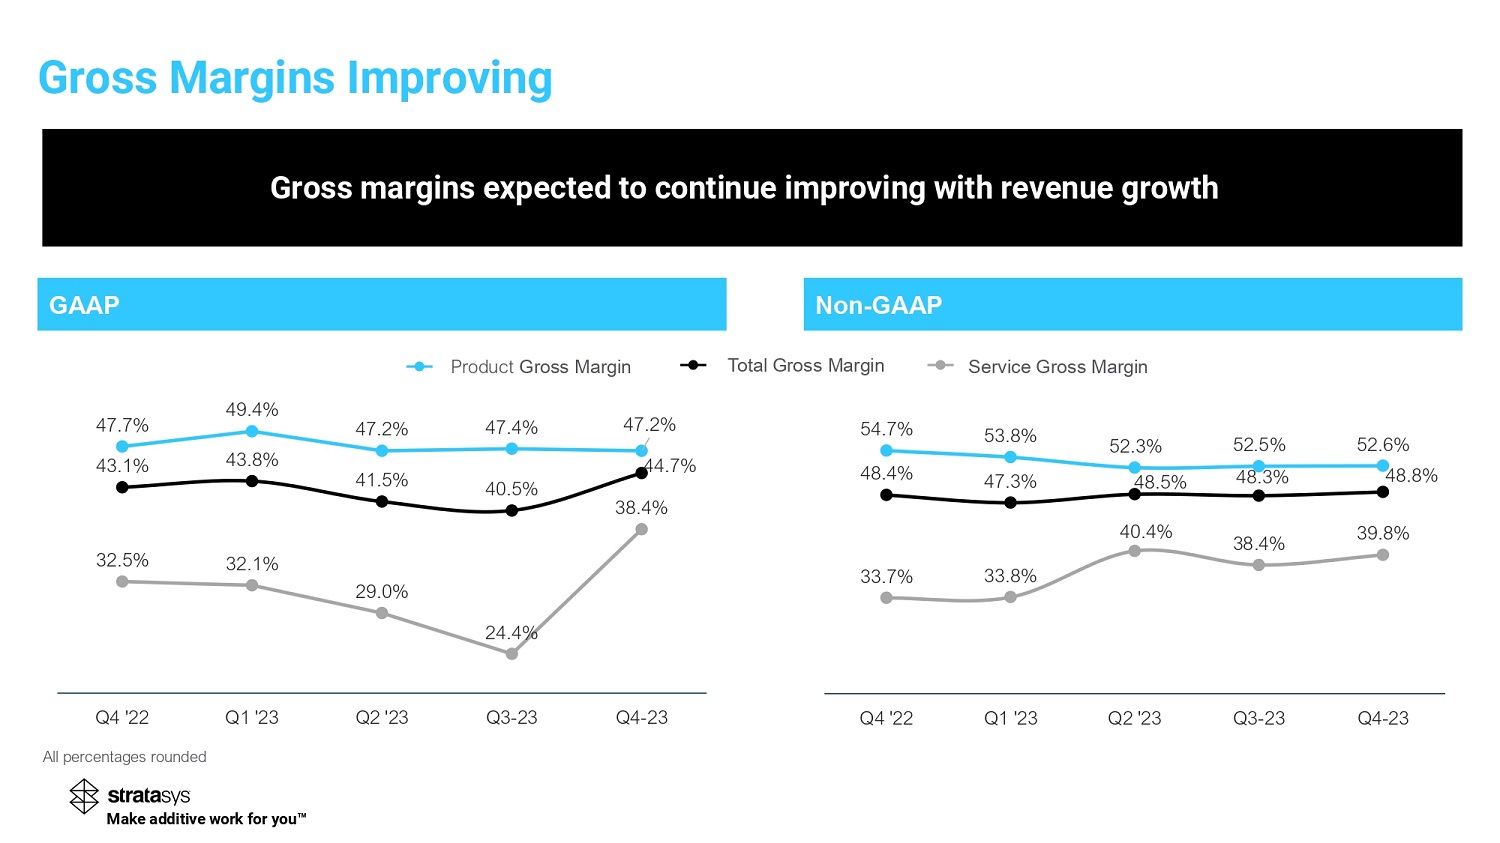
GAAP Non - GAAP 43.1 % 43.8 % 41.5% 40.5 % 44.7% 47.7 % 49.4% 47.2 % 47.4 % 47.2 % 32.5% 32.1 % 29.0% 24.4 % 38.4% Q4 '22 Q1 '23 Q2 '23 Q3-23 Q4-23 48.4 % 47.3 % 48.5 % 48.3% 48.8 % 54.7% 53.8 % 52.3% 52.5 % 52.6 % 33.7 % 33.8% 40.4 % 38.4% 39.8 % Q4 '22 Q1 '23 Q2 '23 Q3-23 Q4-23 Service Gross Margin Product Gross Margin Total Gross Margin All percentages rounded Gross margins expected to continue improving with revenue growth Make additive work for you Gross Margins Improving
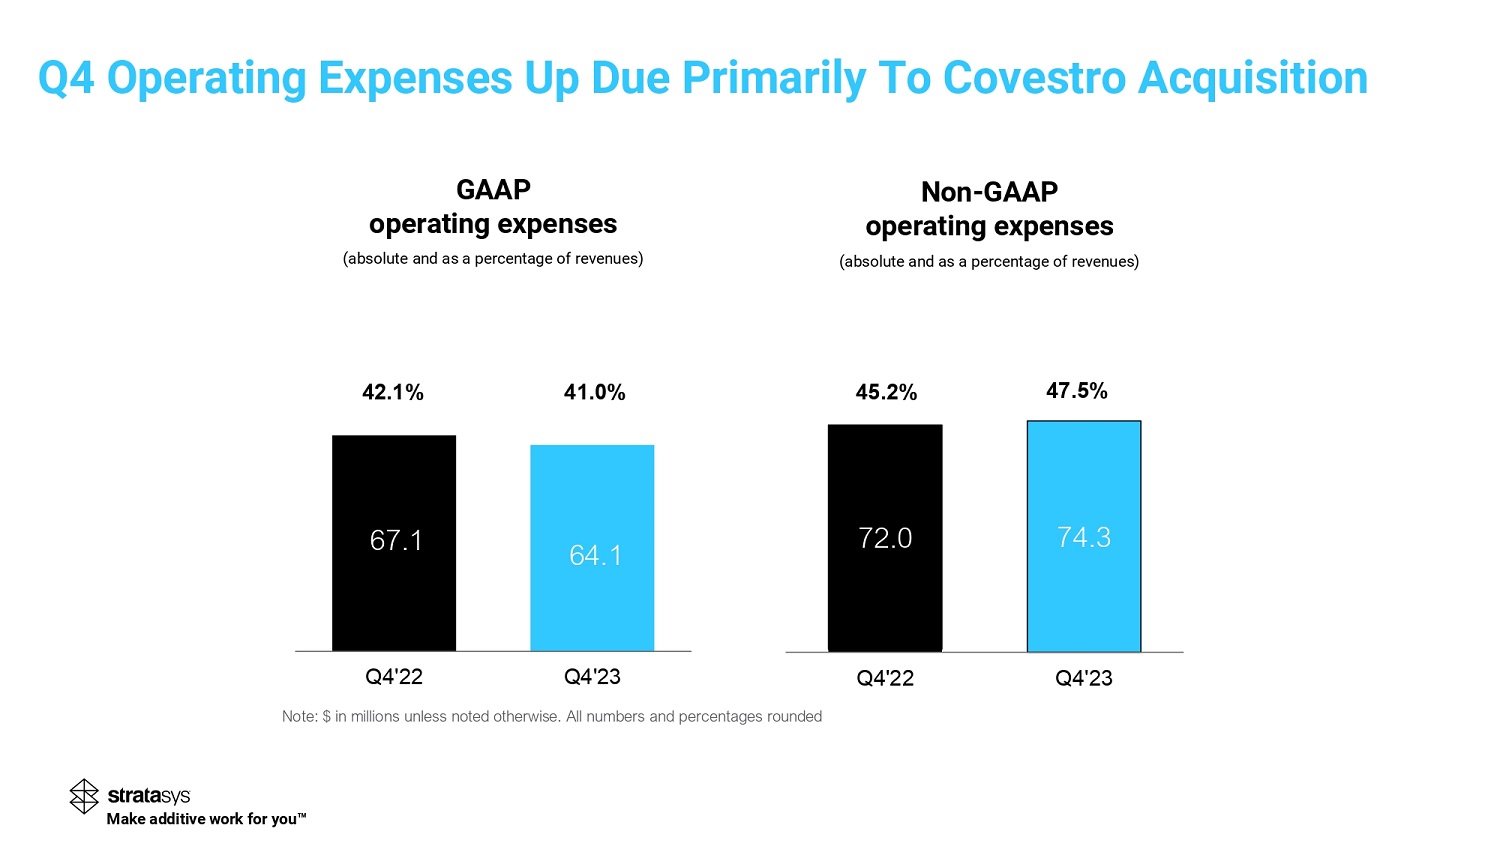
GAAP operating expenses (absolute and as a percentage of revenues) Non - GAAP operating expenses (absolute and as a percentage of revenues) 67.1 64.1 Q4'22 Q4'23 4 . 0 % 72 .0 74.3 Q4'22 Q4'23 47.5% Note: $ in millions unless noted otherwise. All numbers and percentages rounded 42.1 % 45.2 % Make additive work for you Q 4 Operating Expenses Up Due Primarily To Covestro Acquisition
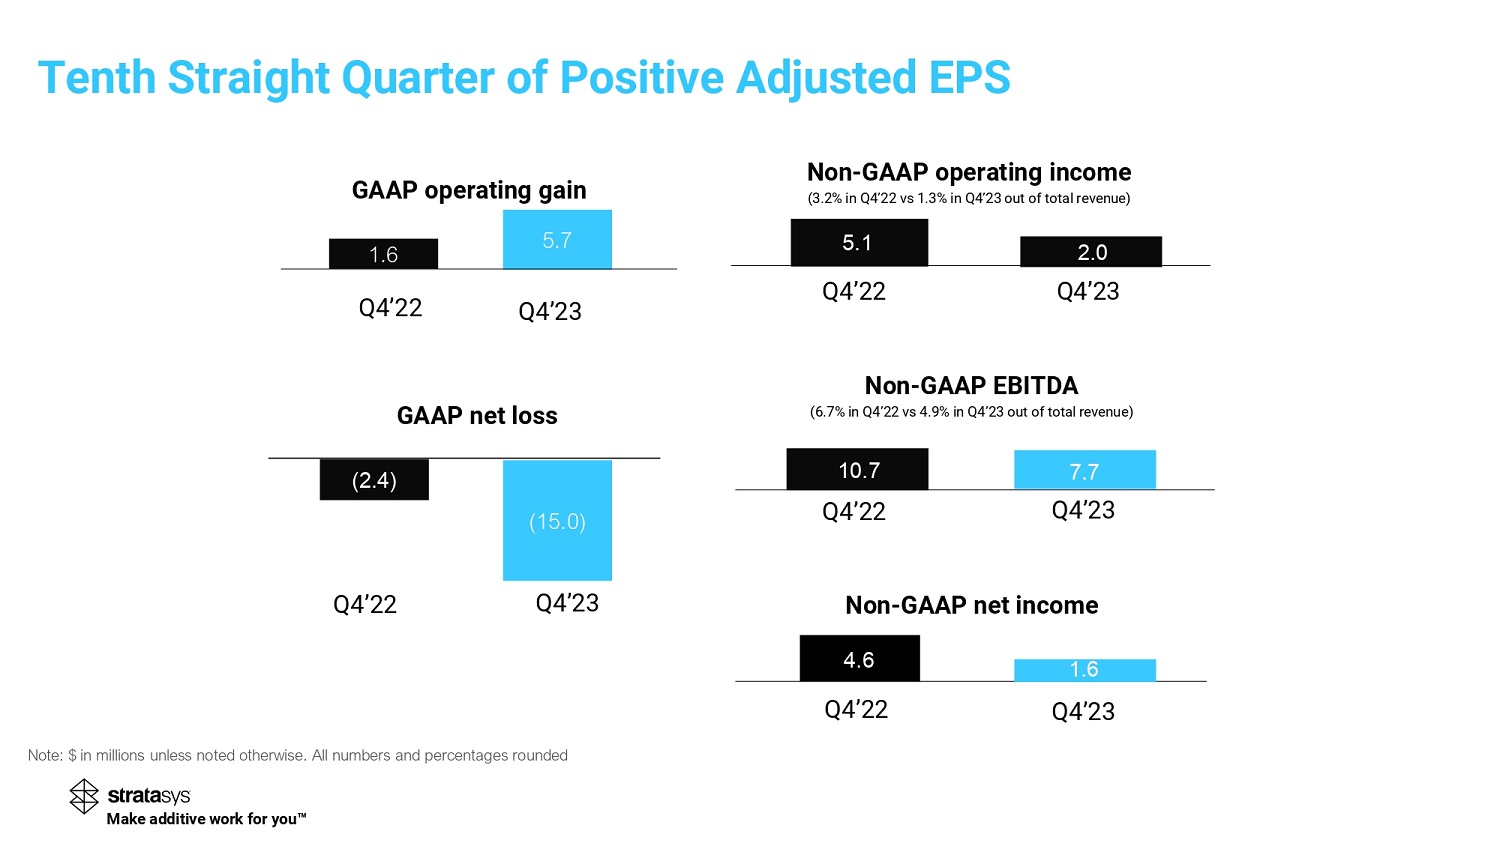
( 2.4 ) ( 15.0 ) 1.6 5.7 Non - GAAP operating income ( 3.2 % in Q 4 ’ 22 vs 1.3 % in Q 4 ’ 23 out of total revenue) GAAP operating gain Non - GAAP net income GAAP net loss Note: $ in millions unless noted otherwise. All numbers and percentages rounded Q 4 ’ 22 Q4’23 Q 4 ’ 22 Q 4 ’ 23 Q 4 ’ 22 Q4’23 Q 4 ’ 22 Q 4 ’ 23 Q 4 ’ 22 Q4’23 7.7 10.7 1.6 Non - GAAP EBITDA ( 6.7 % in Q 4 ’ 22 vs 4.9 % in Q 4 ’ 23 out of total revenue) 5.1 2.0 4.6 Make additive work for you Tenth Straight Quarter of Positive Adjusted EPS
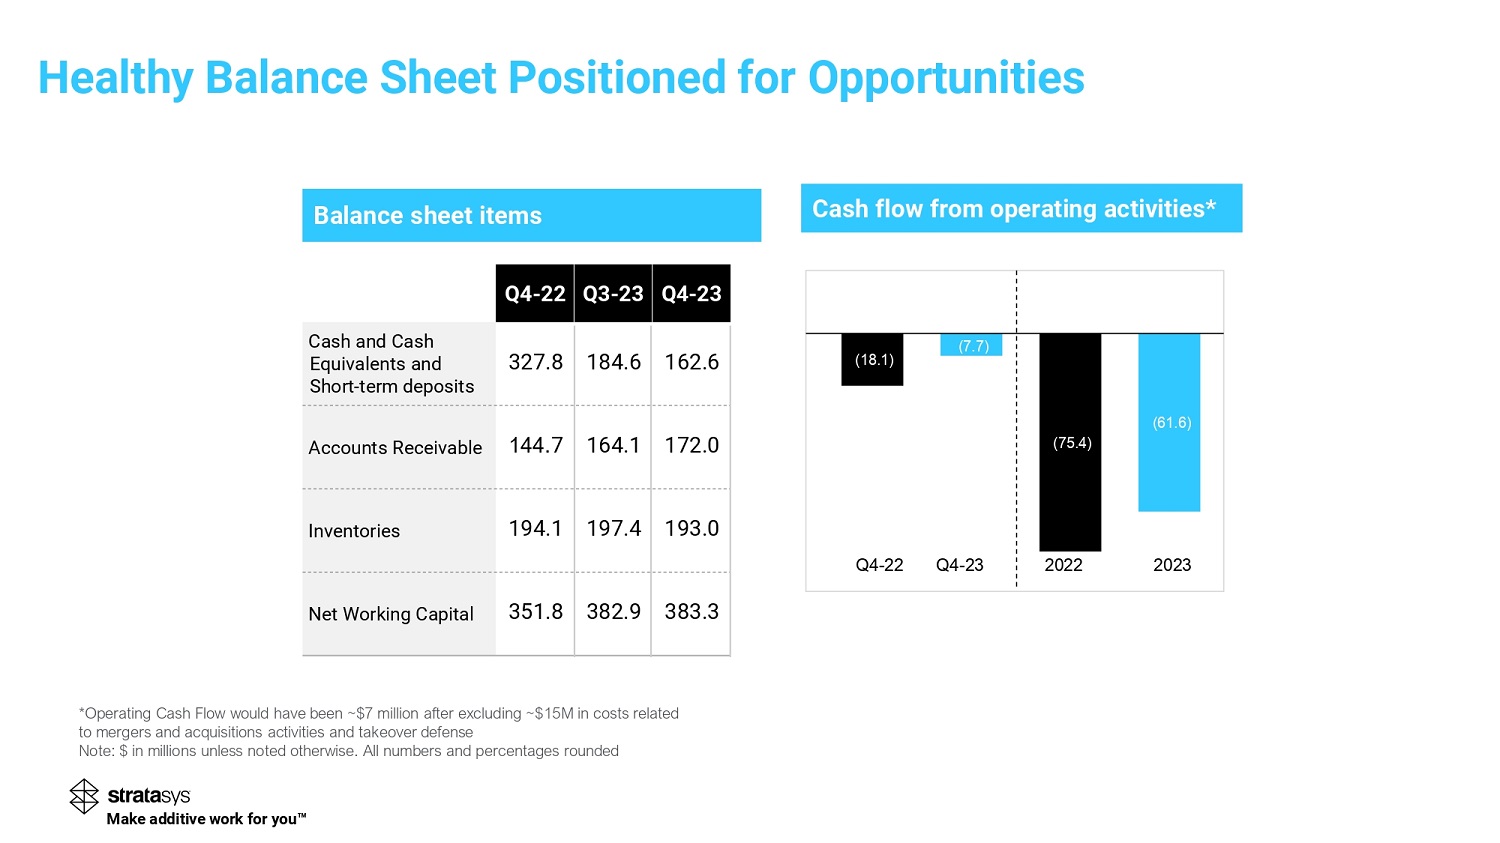
Balance sheet items Cash flow from operating activities* Q - 23 Q3 - 23 Q4 - 22 162.6 184.6 327.8 Cash and Cash Equivalents and Short - term deposits 172.0 164.1 7 Accounts Receivable 193.0 197.4 194.1 Inventories 383.3 382.9 351.8 Net Working Capital 16 *Operating Cash Flow would have been ~$ 7 million after excluding ~$ 15 M in costs related to mergers and acquisitions activities and takeover defense Note: $ in millions unless noted otherwise. All numbers and percentages rounded Make additive work for you ( 18.1 ) (7.7) (75.4) ( 61.6 ) Q 4 - 22 Q 4 - 23 2022 2023 Healthy Balance Sheet Positioned for Opportunities
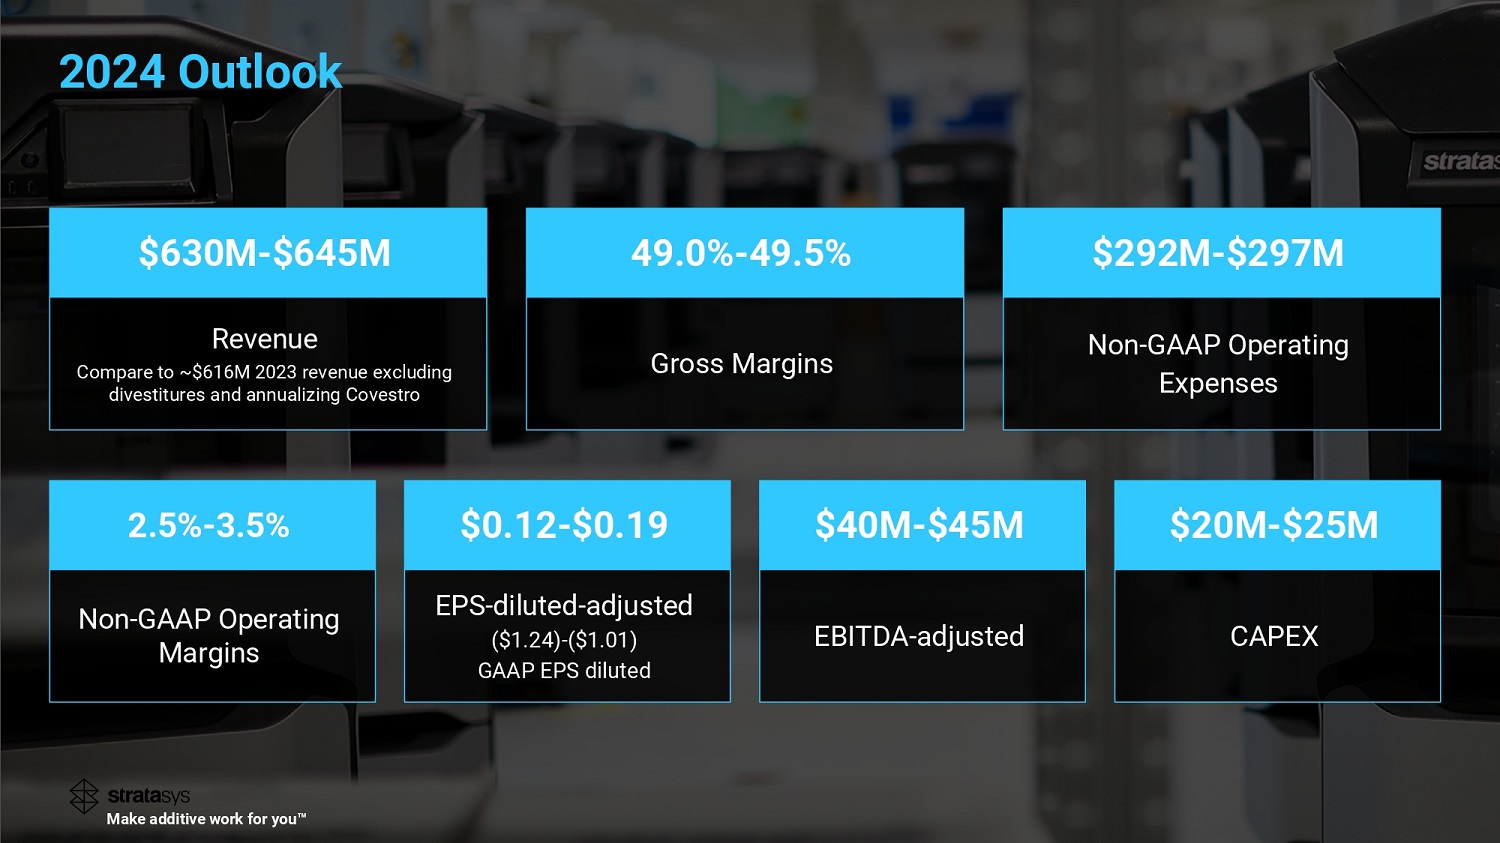
Revenue Compare to ~$ 616 M 2023 revenue excluding divestitures and annualizing Covestro Gross Margins Non - GAAP Operating Expenses Non - GAAP Operating Margins EPS - diluted - adjusted ($1.24) - ($1.01) GAAP EPS diluted CAPEX EBITDA - adjusted $ 630 M - $ 645 M 49.0 % - 49.5 % $292M - $297M 2.5 % - 3.5 % $0.12 - $ 0.19 $20M - $25M $ 40 M - $ 45 M Make additive work for you 2024 Outlook
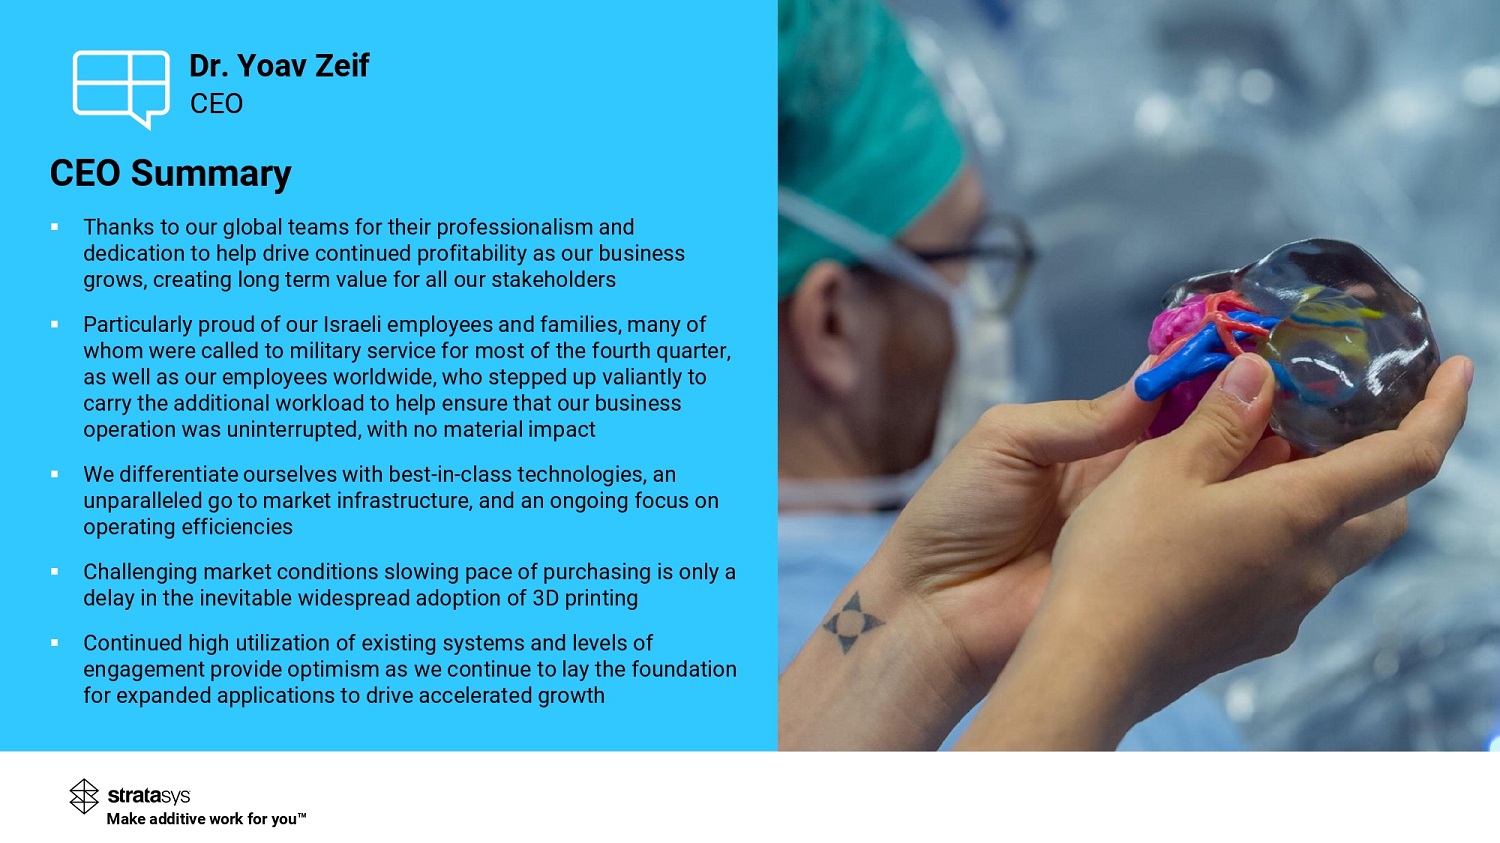
CEO Dr. Yoav Zeif CEO Summary ▪ Thanks to our global teams for their professionalism and dedication to help drive continued profitability as our business grows, creating long term value for all our stakeholders ▪ Particularly proud of our Israeli employees and families, many of whom were called to military service for most of the fourth quarter, as well as our employees worldwide, who stepped up valiantly to carry the additional workload to help ensure that our business operation was uninterrupted, with no material impact ▪ We differentiate ourselves with best - in - class technologies, an unparalleled go to market infrastructure, and an ongoing focus on operating efficiencies ▪ Challenging market conditions slowing pace of purchasing is only a delay in the inevitable widespread adoption of 3D printing ▪ Continued high utilization of existing systems and levels of engagement provide optimism as we continue to lay the foundation for expanded applications to drive accelerated growth Make additive work for you

19 THANK YOU. Make additive work for you
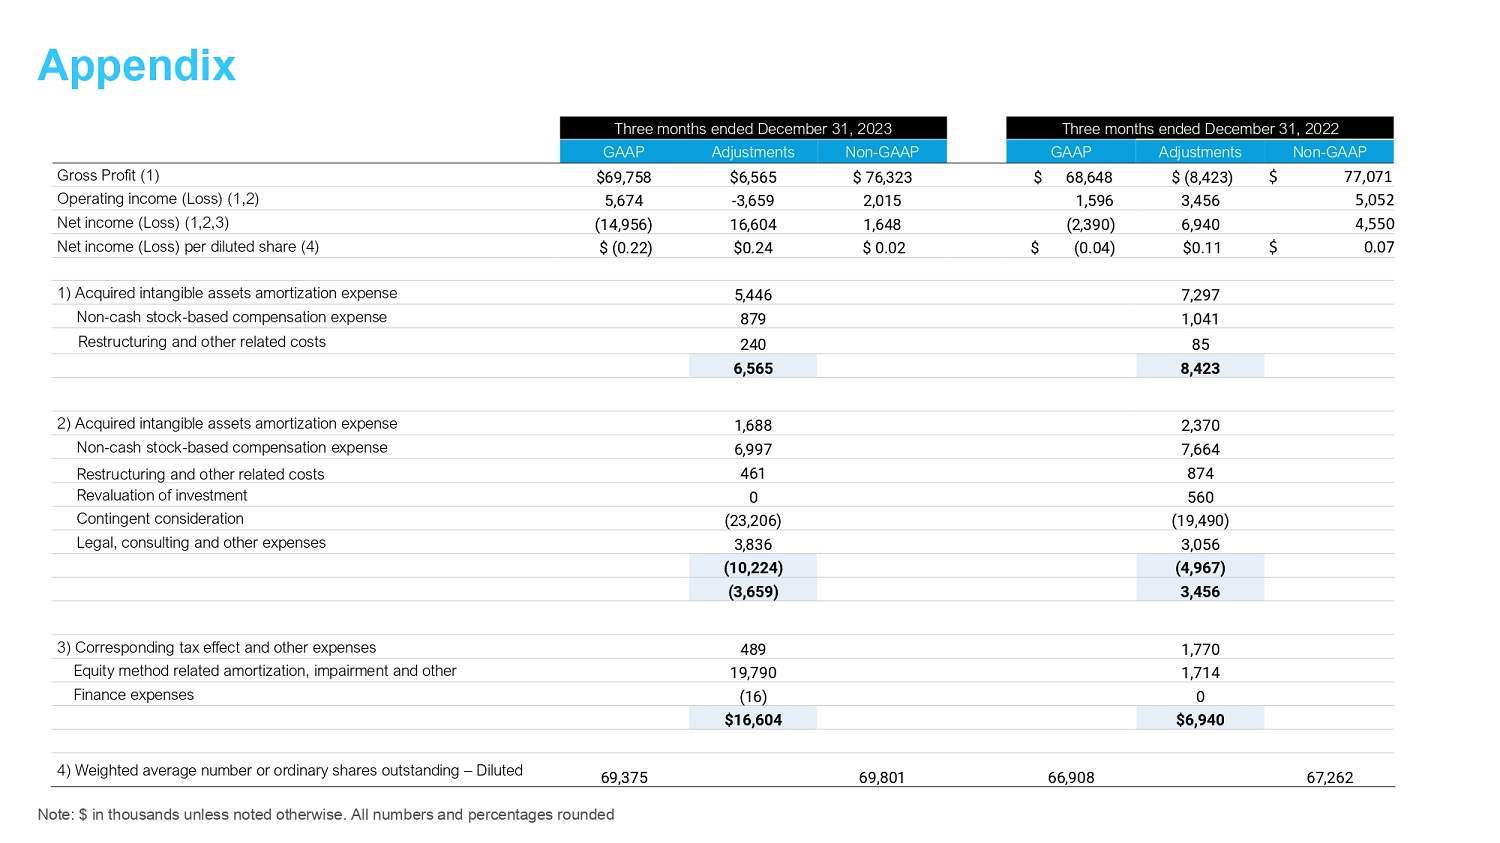
Appendix Note: $ in thousands unless noted otherwise. All numbers and percentages rounded Three months ended December 31 , 2022 Three months ended December 31 , 2023 Non - GAAP Adjustments GAAP Non - GAAP Adjustments GAAP $ 77,071 $ (8,423) $ 68,648 $ 76,323 $6,565 $69,758 Gross Profit (1) 5,052 3,456 1,596 2,015 - 3,659 5,674 Operating income (Loss) (1,2) 4,550 6,940 (2,390) 1,648 16,604 (14,956) Net income (Loss) (1,2,3) $ 0.07 $0.11 $ ( 0.04 ) $ 0.02 $0.24 $ (0.22) Net income (Loss) per diluted share (4) 7,297 5,446 1) Acquired intangible assets amortization expense 1,041 879 Non - cash stock - based compensation expense 85 240 Restructuring and other related costs 8,423 6,565 2,370 1,688 2) Acquired intangible assets amortization expense 7,664 6,997 Non - cash stock - based compensation expense 874 461 Restructuring and other related costs 560 0 Revaluation of investment (19,490) (23,206) Contingent consideration 3,056 3,836 Legal, consulting and other expenses (4,967) (10,224) 3,456 (3,659) 1,770 489 3) Corresponding tax effect and other expenses 1,714 19,790 Equity method related amortization, impairment and other (16) Finance expenses $6,940 $16,604 67,262 66,908 69,801 69,375 4) Weighted average number or ordinary shares outstanding – Diluted