Exhibit 99.2
Q3 2023 Results Speakers Dr. Yoav Zeif, CEO Eitan Zamir, CFO Yonah Lloyd, CCO & VP IR November 16, 2023

Conference Call and Webcast Details US Toll - Free Dial - In 1 - 877 - 407 - 0619 International Dial - In 1 - 412 - 902 - 1012 Live Webcast and Replay https://event.choruscall.com/mediaframe/webcast.htm l?webcastid=bSk6aoYV 2 2

Forward - Looking Statements Cautionary Statement Regarding Forward - Looking Statements The statements in this slide presentation regarding Stratasys' strategy, and the statements regarding its projected future financial performance, including the financial guidance concerning its expected results for 2023, are forward - looking statements reflecting management's current expectations and beliefs. These forward - looking statements are based on current information that is, by its nature, subject to rapid and even abrupt change. Due to risks and uncertainties associated with Stratasys' business, actual results could differ materially from those projected or implied by these forward - looking statements. These risks and uncertainties include, but are not limited to: the degree of our success at introducing new or improved products and solutions that gain market share; the extent of growth of the 3D printing market generally; the duration and severity of headwinds caused by current macro - economic trends that have been adversely affecting, and may continue to adversely affect, our results, including unfavorable currency exchange rates, inflationary pressures and higher interest rates; the impact of potential shifts in the prices or margins of the products that we sell or services that we provide, including due to a shift towards lower margin products or services; the impact of competition and new technologies; the outcome and degree of success of our board’s comprehensive process to explore strategic alternatives for our company; the degree of impact of I srael’s war against the terrorist organization Hamas, given our Israeli headquarters, factories and significant operations; the extent of our success at successfully integrating into our existing business, or making additional, acquisitions or investments in new businesses, technologies, products or services; potential changes in our management and board of directors; global market, political and economic conditions, and in the countries in which we operate in particular (including risks stemming from Russia’s invasion of Ukraine); potential further charges against earnings that we could be required to take due to impairment of additional goodwill or other intangible assets that we have recently acquired or may acquire in the future; costs and potential liability relating to litigation and regulatory proceedings; risks related to infringement of our intellectual property rights by others or infringement of others' intellectual property rights by us; the extent of our success at maintaining our liquidity and financing our operations and capital needs; the impact of tax regulations on our results of operations and financial condition; and those additional factors referred to in Item 3.D “Key Information - Risk Factors”, Item 4, “Information on the Company”, Item 5, “Operating and Financial Review and Prospects,” and all other parts of our Annual Report on Form 20 - F for the year ended December 31, 2022, filed with the SEC on March 3, 2023 (the “2022 Annual Report”). Readers are urged to carefully review and consider the various disclosures made throughout our 2022 Annual Report and the Reports of Foreign Private Issuer on Form 6 - K that attach Stratasys’ unaudited, condensed consolidated financial statements and its review of its results of operations and financial condition, for the third quarter of 2023, which Stratasys is furnishing to the SEC today, and our other reports filed with or furnished to the SEC, which are designed to advise interested parties of the risks and factors that may affect our business, financial condition, results of operations and prospects. Any guidance provided, and other forward - looking statements made, in this slide presentation are made as of the date hereof, and Stratasys undertakes no obligation to publicly update or revise any forward - looking statements, whether as a result of new information, future events or otherwise, except as required by law.
Use of Non - GAAP Financial Information Use of Non - GAAP Financial Measures The non - GAAP data included herein, which excludes certain items as described below, are non - GAAP financial measures. Our management believes that these non - GAAP financial measures are useful information for investors and shareholders of our Company in gauging our results of operations (i) on an ongoing basis after excluding mergers, acquisitions and divestments related expense or gains and reorganization - related charges or gains, legal provisions, and (ii) excluding non - cash items such as stock - based compensation expenses, acquired intangible assets amortization, including intangible assets amortization related to equity method investments, impairment of long - lived assets and goodwill, revaluation of our investments and the corresponding tax effect of those items. The items eliminated via these non - GAAP adjustments either do not reflect actual cash outlays that impact our liquidity and our financial condition or have a non - recurring impact on the statement of operations, as assessed by management. These non - GAAP financial measures are presented to permit investors to more fully understand how management assesses our performance for internal planning and forecasting purposes. The limitations of using these non - GAAP financial measures as performance measures are that they provide a view of our results of operations without including all items indicated above during a period, which may not provide a comparable view of our performance to other companies in our industry. Investors and other readers should consider non - GAAP measures only as supplements to, not as substitutes for or as superior measures to, the measures of financial performance prepared in accordance with GAAP. Reconciliation between results on a GAAP and non - GAAP basis is provided in a table later in this slide presentation.
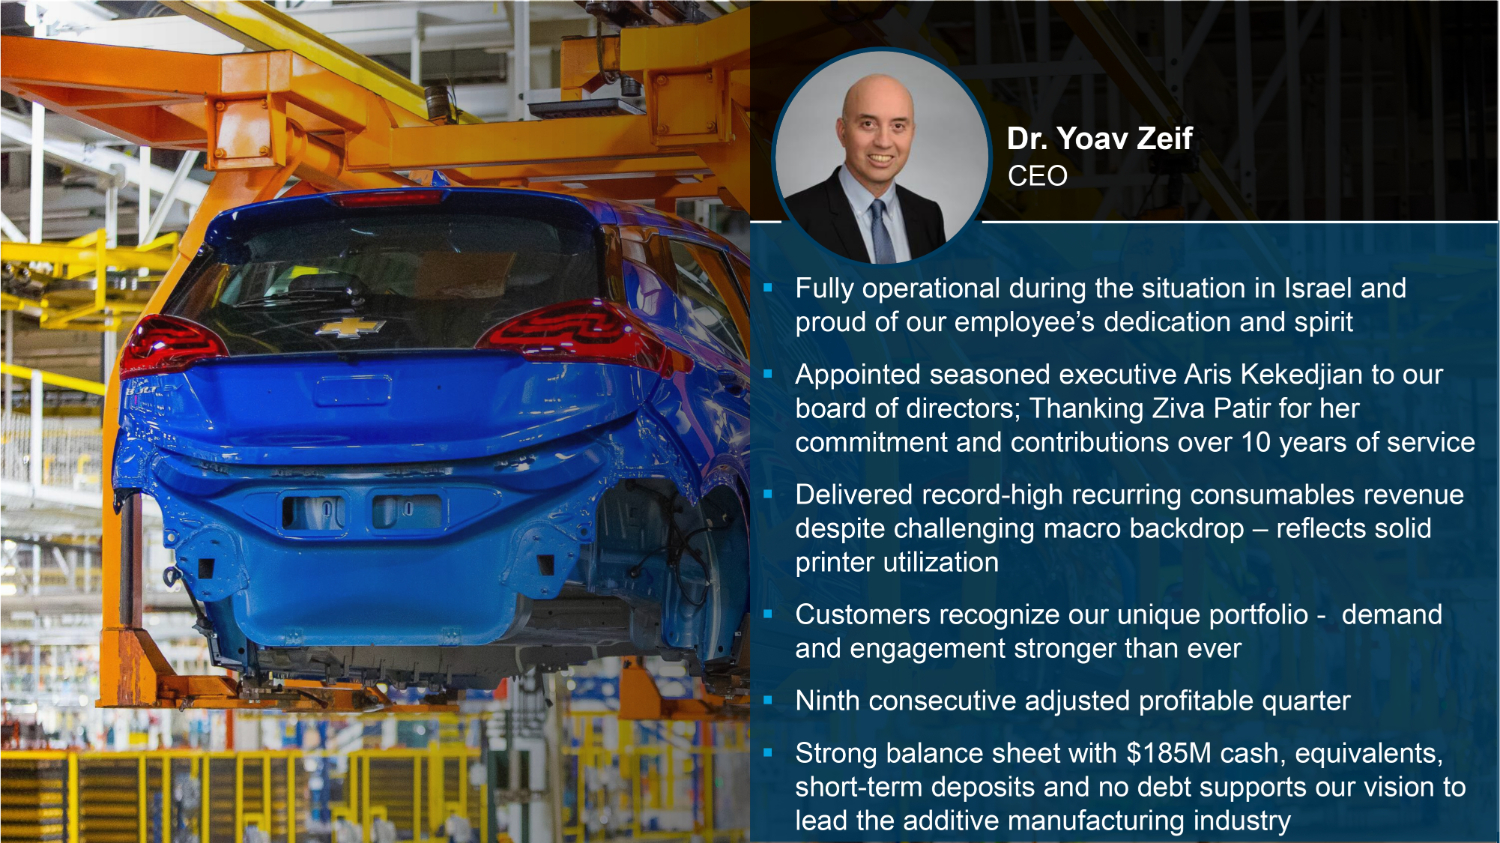
CEO Dr. Yoav Zeif ▪ Fully operational during the situation in Israel and proud of our employee’s dedication and spirit ▪ Appointed seasoned executive Aris Kekedjian to our board of directors; Thanking Ziva Patir for her commitment and contributions over 10 years of service ▪ Delivered record - high recurring consumables revenue despite challenging macro backdrop – reflects solid printer utilization ▪ Customers recognize our unique portfolio - demand and engagement stronger than ever ▪ Ninth consecutive adjusted profitable quarter ▪ Strong balance sheet with $185M cash, equivalents, short - term deposits and no debt supports our vision to lead the additive manufacturing industry
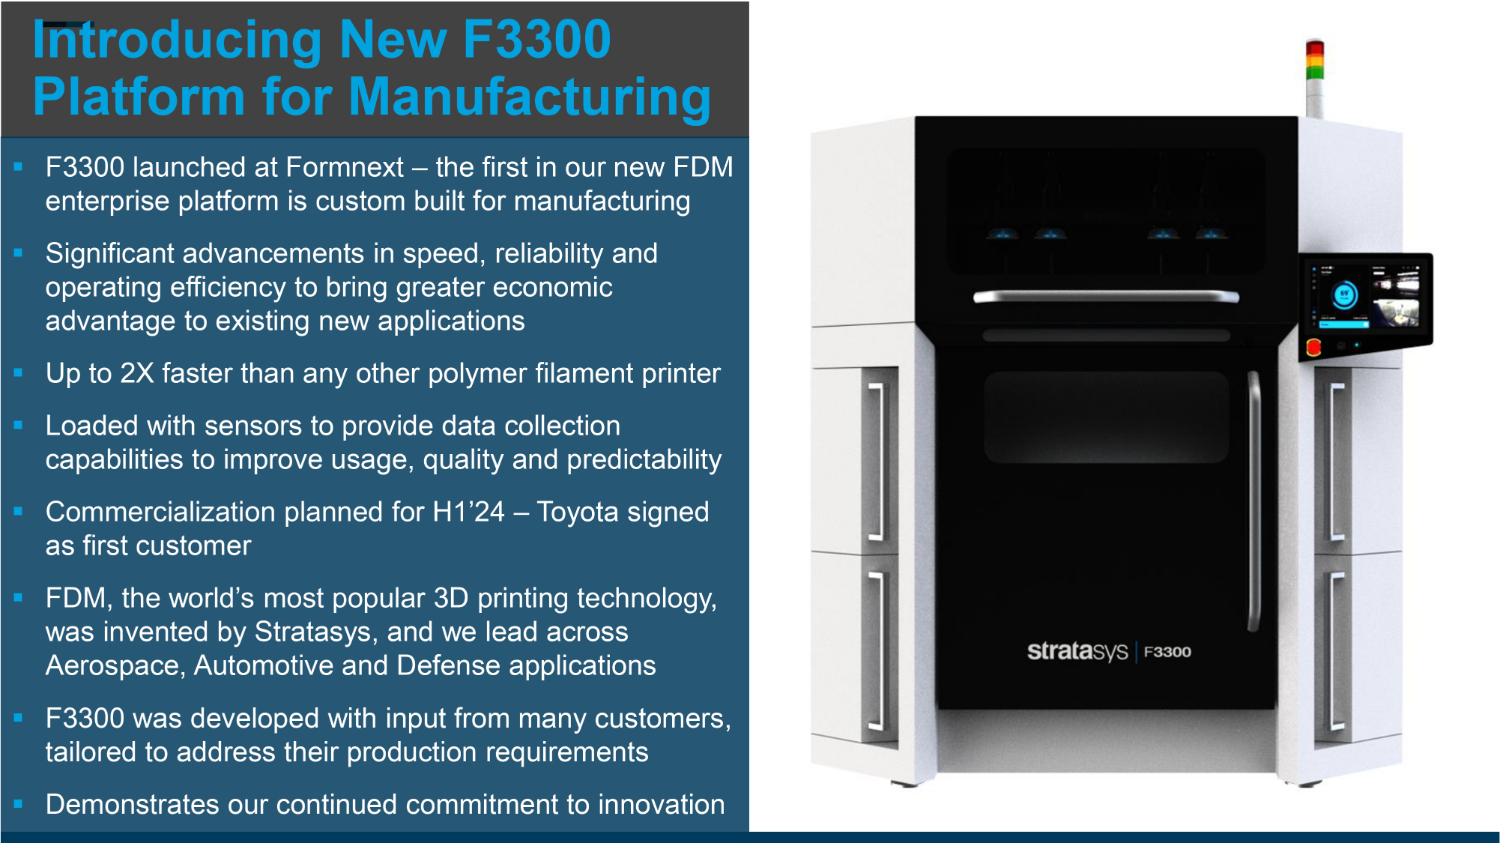
Introducing New F3300 Platform for Manufacturing ▪ F3300 launched at Formnext – the first in our new FDM enterprise platform is custom built for manufacturing ▪ Significant advancements in speed, reliability and operating efficiency to bring greater economic advantage to existing new applications ▪ Up to 2X faster than any other polymer filament printer ▪ Loaded with sensors to provide data collection capabilities to improve usage, quality and predictability ▪ Commercialization planned for H1’24 – Toyota signed as first customer ▪ FDM, the world’s most popular 3D printing technology, was invented by Stratasys, and we lead across Aerospace, Automotive and Defense applications ▪ F3300 was developed with input from many customers, tailored to address their production requirements ▪ Demonstrates our continued commitment to innovation
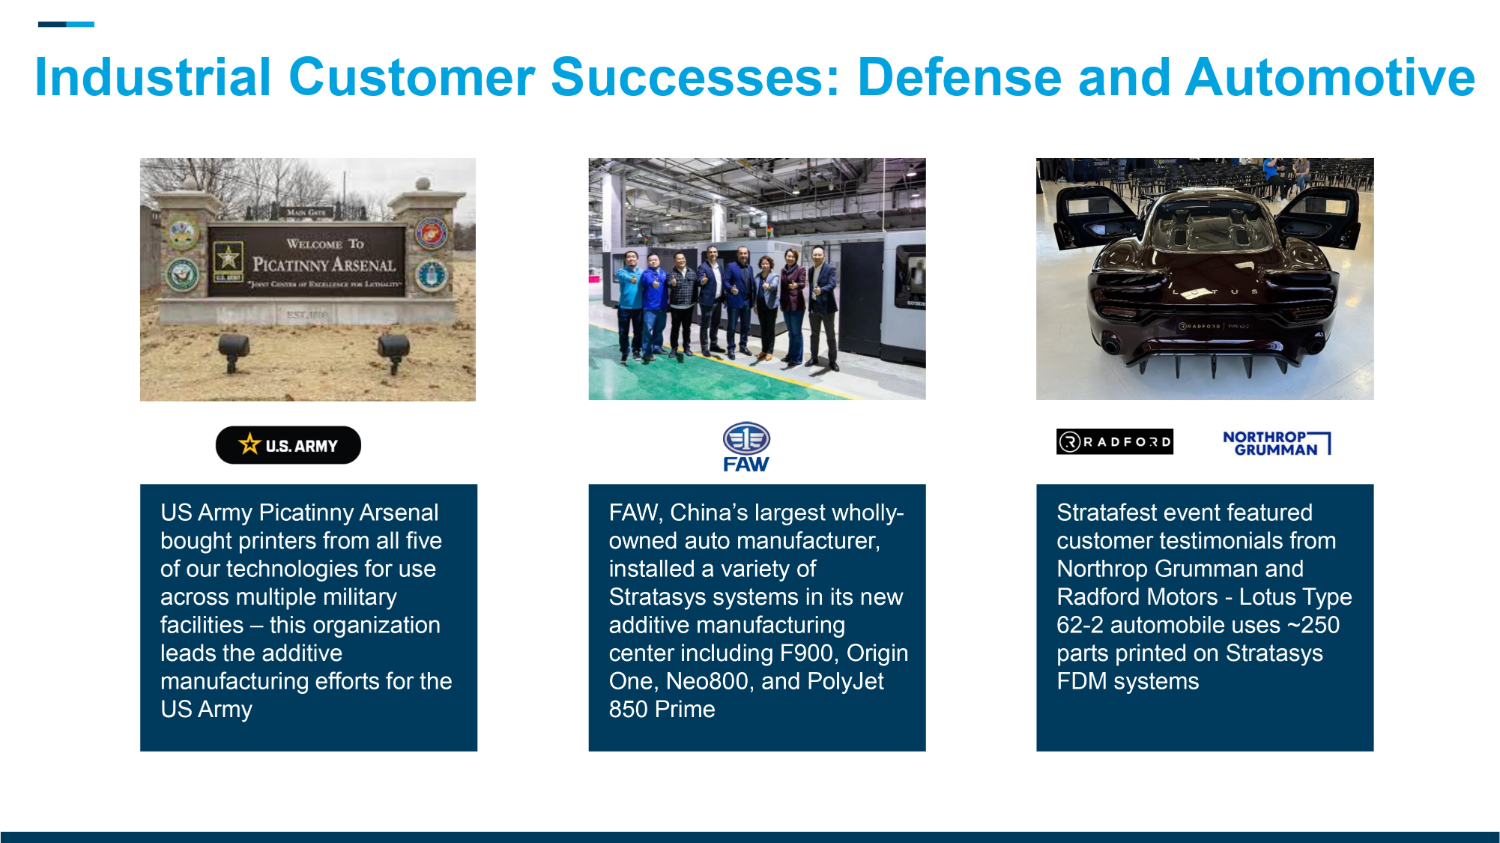
FAW, China’s largest wholly - owned auto manufacturer, installed a variety of Stratasys systems in its new additive manufacturing center including F900, Origin One, Neo800, and PolyJet 850 Prime Stratafest event featured customer testimonials from Northrop Grumman and Radford Motors - Lotus Type 62 - 2 automobile uses ~250 parts printed on Stratasys FDM systems US Army Picatinny Arsenal bought printers from all five of our technologies for use across multiple military facilities – this organization leads the additive manufacturing efforts for the US Army Industrial Customer Successes: Defense and Automotive
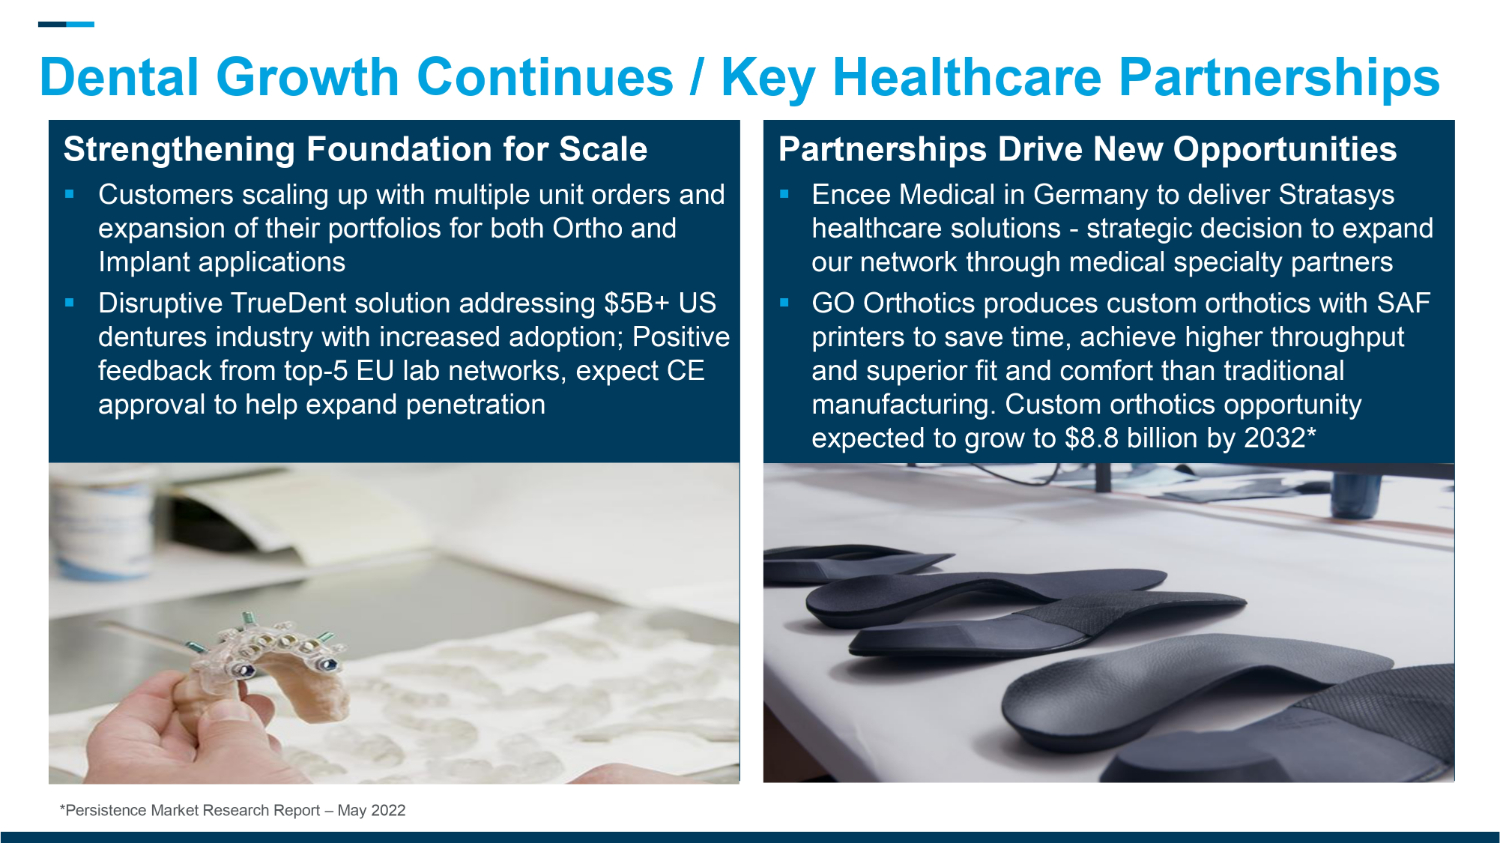
Partnerships Drive New Opportunities ▪ Encee Medical in Germany to deliver Stratasys healthcare solutions - strategic decision to expand our network through medical specialty partners ▪ GO Orthotics produces custom orthotics with SAF printers to save time, achieve higher throughput and superior fit and comfort than traditional manufacturing. Custom orthotics opportunity expected to grow to $8.8 billion by 2032* Dental Growth Continues / Key Healthcare Partnerships *Persistence Market Research Report – May 2022 Strengthening Foundation for Scale ▪ Customers scaling up with multiple unit orders and expansion of their portfolios for both Ortho and Implant applications ▪ Disruptive TrueDent solution addressing $5B+ US dentures industry with increased adoption; Positive feedback from top - 5 EU lab networks, expect CE approval to help expand penetration
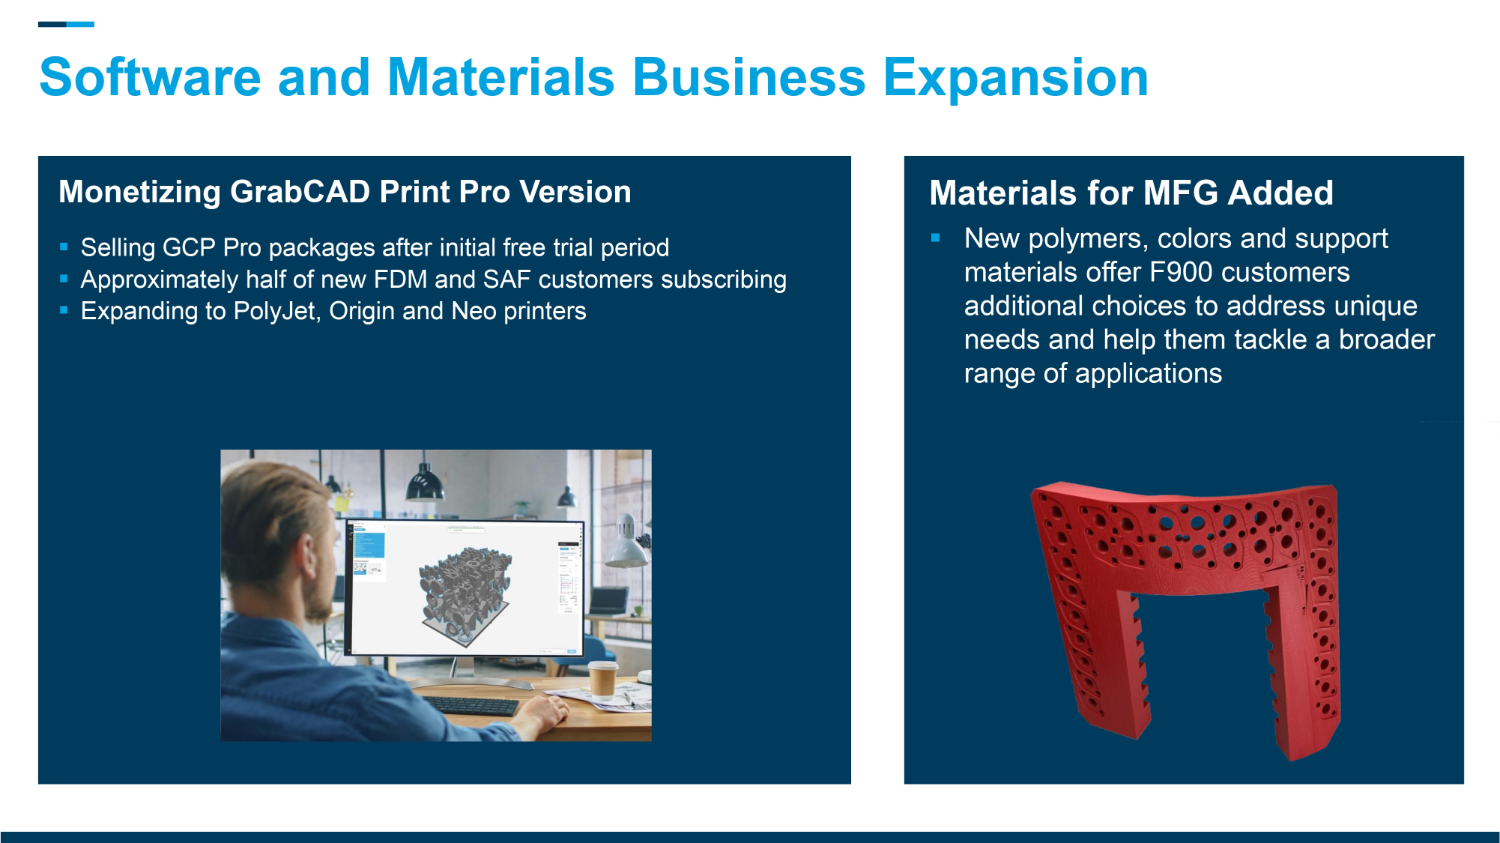
Software and Materials Business Expansion Monetizing GrabCAD Print Pro Version ▪ Selling GCP Pro packages after initial free trial period ▪ Approximately half of new FDM and SAF customers subscribing ▪ Expanding to PolyJet, Origin and Neo printers Materials for MFG Added ▪ New polymers, colors and support materials offer F900 customers additional choices to address unique needs and help them tackle a broader range of applications
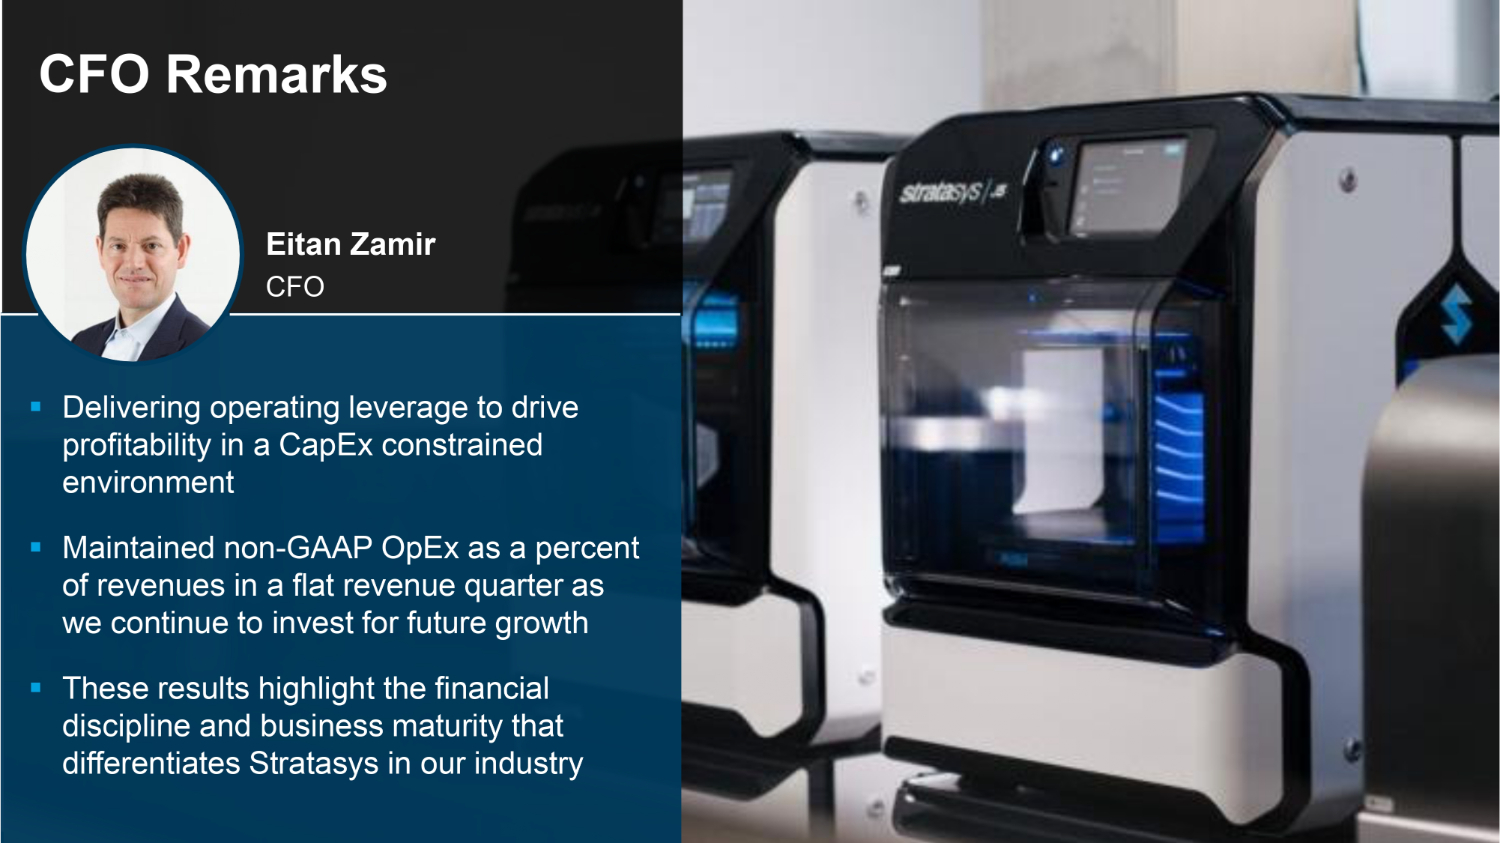
▪ Delivering operating leverage to drive profitability in a CapEx constrained environment ▪ Maintained non - GAAP OpEx as a percent of revenues in a flat revenue quarter as we continue to invest for future growth ▪ These results highlight the financial discipline and business maturity that differentiates Stratasys in our industry CFO Eitan Zamir CFO Remarks
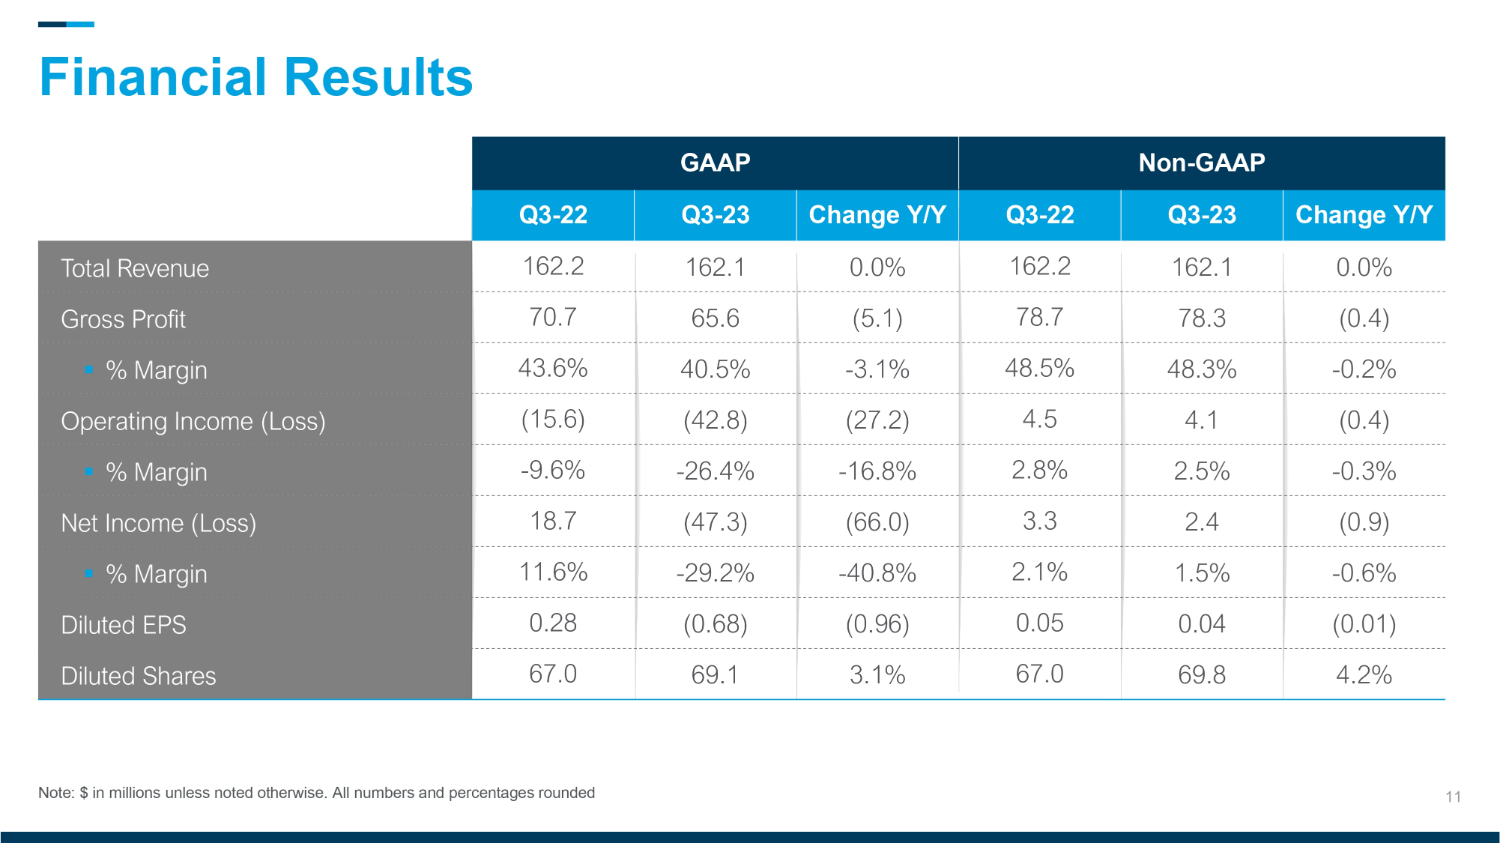
11 Non - GAAP GAAP Change Y/Y Q3 - 23 Q3 - 22 Change Y/Y Q3 - 23 Q3 - 22 0.0% 162.1 162.2 0.0% 162.1 162.2 Total Revenue (0.4) 78.3 78.7 (5.1) 65.6 70.7 Gross Profit - 0.2% 48.3% 48.5% - 3.1% 40.5% 43.6% ▪ % Margin (0.4) 4.1 4.5 (27.2) (42.8) (15.6) Operating Income (Loss) - 0.3% 2.5% 2.8% - 16.8% - 26.4% - 9.6% ▪ % Margin (0.9) 2.4 3.3 (66.0) (47.3) 18.7 Net Income (Loss) - 0.6% 1.5% 2.1% - 40.8% - 29.2% 11.6% ▪ % Margin (0.01) 0.04 0.05 (0.96) (0.68) 0.28 Diluted EPS 4.2% 69.8 67.0 3.1% 69.1 6 7.0 Diluted Shares Note: $ in millions unless noted otherwise. All numbers and percentages rounded Financial Results
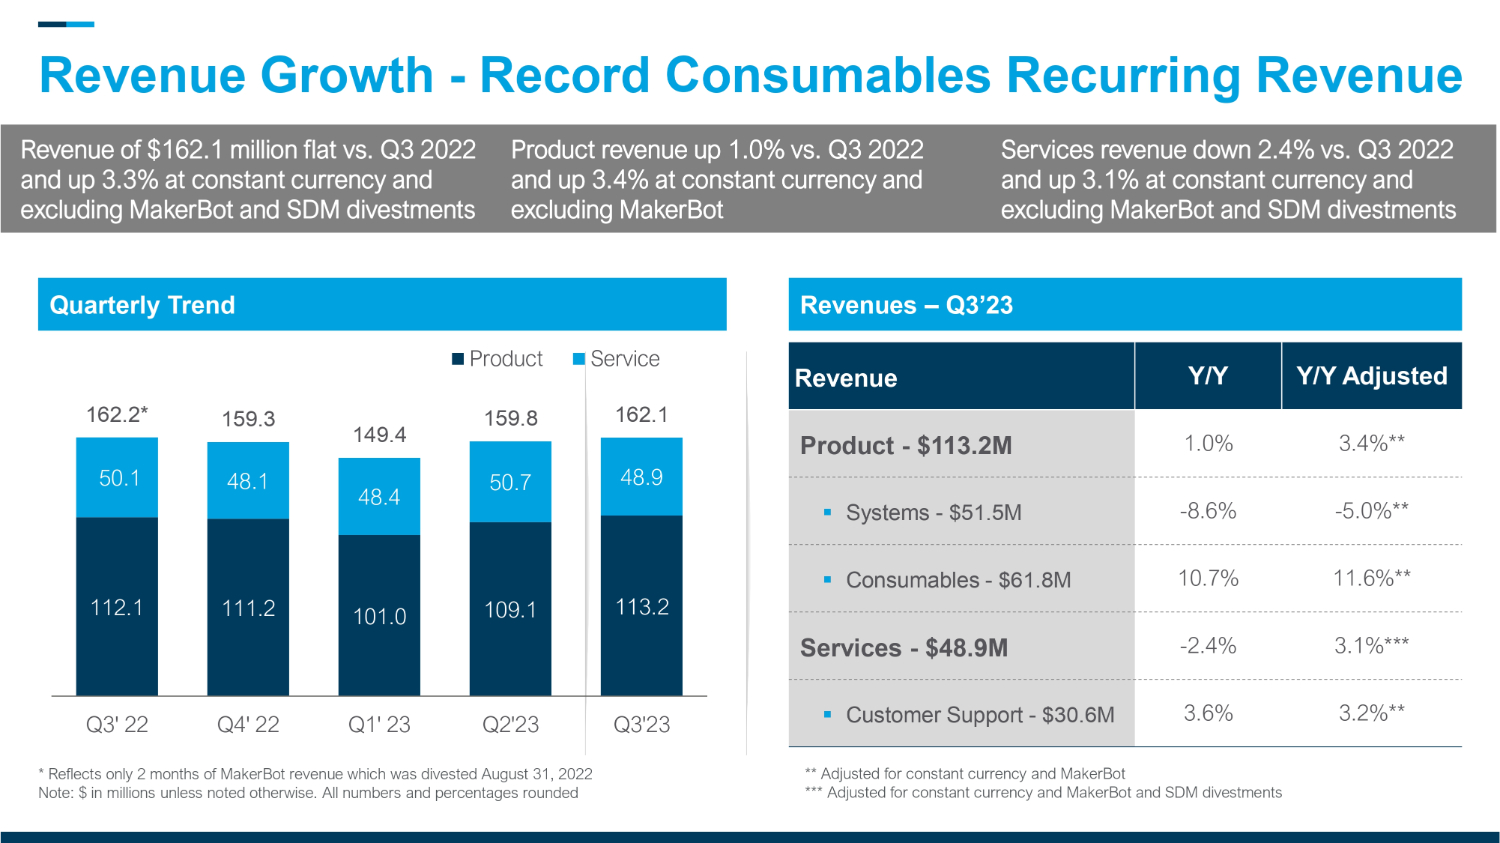
* Reflects only 2 months of MakerBot revenue which was divested August 31, 2022 Note: $ in millions unless noted otherwise. All numbers and percentages rounded Quarterly Trend Revenues – Q 3 ’ 2 112.1 111.2 101.0 109.1 113.2 50.1 48.1 48.4 50.7 48.9 162.2* 159.3 149.4 159.8 162.1 Q3' 22 Q4' 22 Q1' 23 Q2'23 Q3'23 Product Service Y/Y Adjusted Y/Y Revenue 3.4 % ** 1.0 % Product - $113.2M - 5.0 % ** - 8.6 % ▪ Systems - $51.5M 11.6%** 10.7% ▪ Consumables - $61.8M 3.1%*** - 2.4% Services - $48.9M 3.2%** 3.6% ▪ Customer Support - $30.6M Revenue of $ 162.1 million flat vs. Q 3 2022 and up 3.3 % at constant currency and excluding MakerBot and SDM divestments Product revenue up 1.0 % vs. Q 3 2022 and up 3.4 % at constant currency and excluding MakerBot Services revenue down 2.4 % vs. Q 3 2022 and up 3.1 % at constant currency and excluding MakerBot and SDM divestments Revenue Growth - Record Consumables Recurring Revenue ** Adjusted for constant currency and MakerBot *** Adjusted for constant currency and MakerBot and SDM divestments
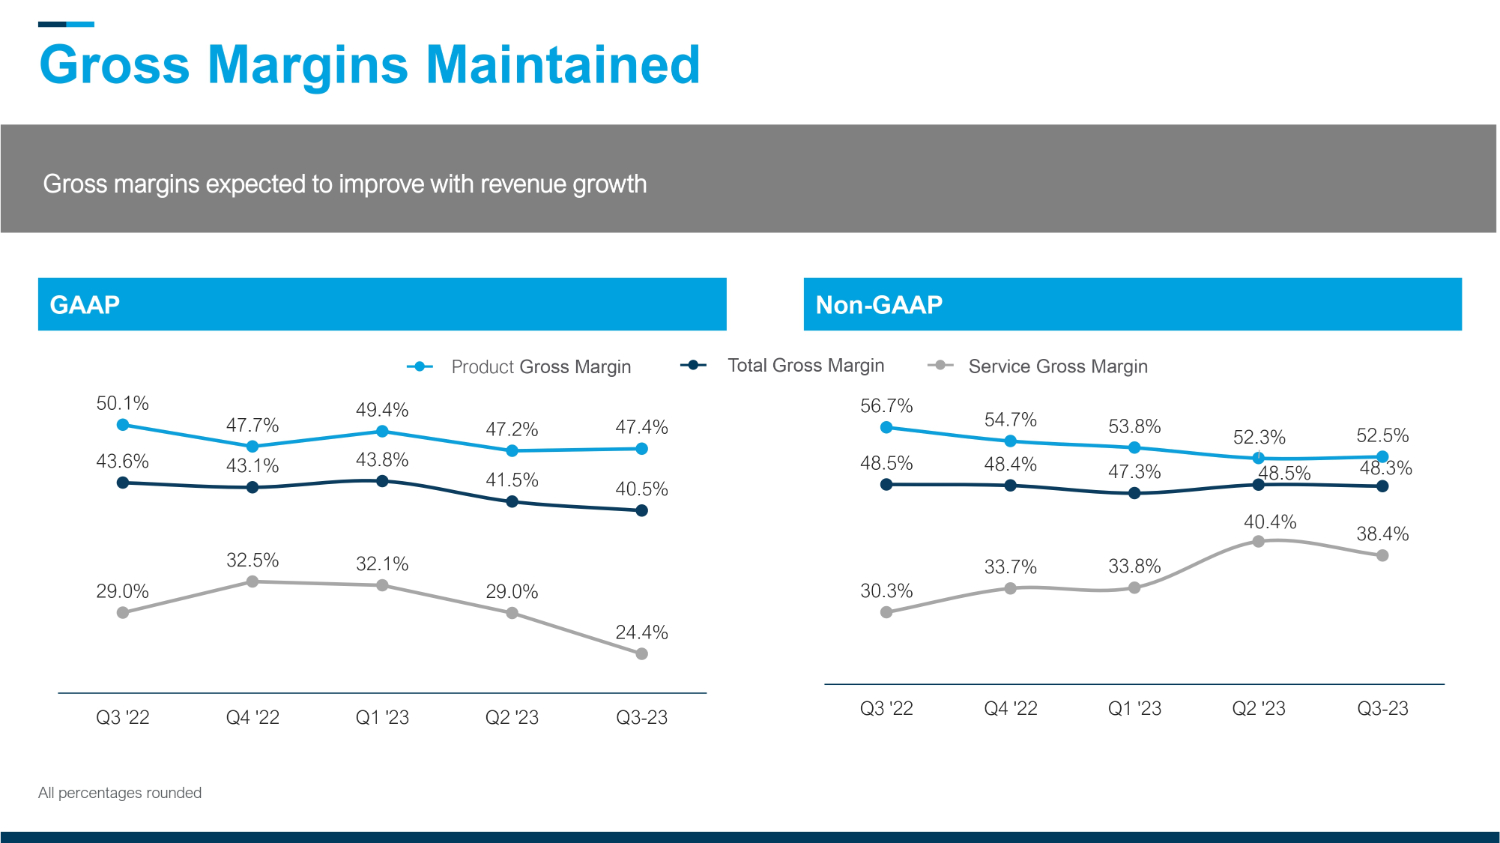
Gross Margins Maintained GAAP Non - GAAP 43.6% 43.1% 43.8% 41.5 % 40.5% 50.1% 47.7% 49.4% 47.2% 47.4% 29.0% 32.5 % 32.1% 29.0% 24.4% Q3 '22 Q4 '22 Q1 '23 Q2 '23 Q3-23 48.5% 48.4% 47.3% 48.5% 48.3 % 56.7% 54.7% 53.8% 52.3% 52.5% 30.3% 33.7% 33.8 % 40.4% 38.4% Q3 '22 Q4 '22 Q1 '23 Q2 '23 Q3-23 Service Gross Margin Product Gross Margin Total Gross Margin All percentages rounded Gross margins expected to improve with revenue growth
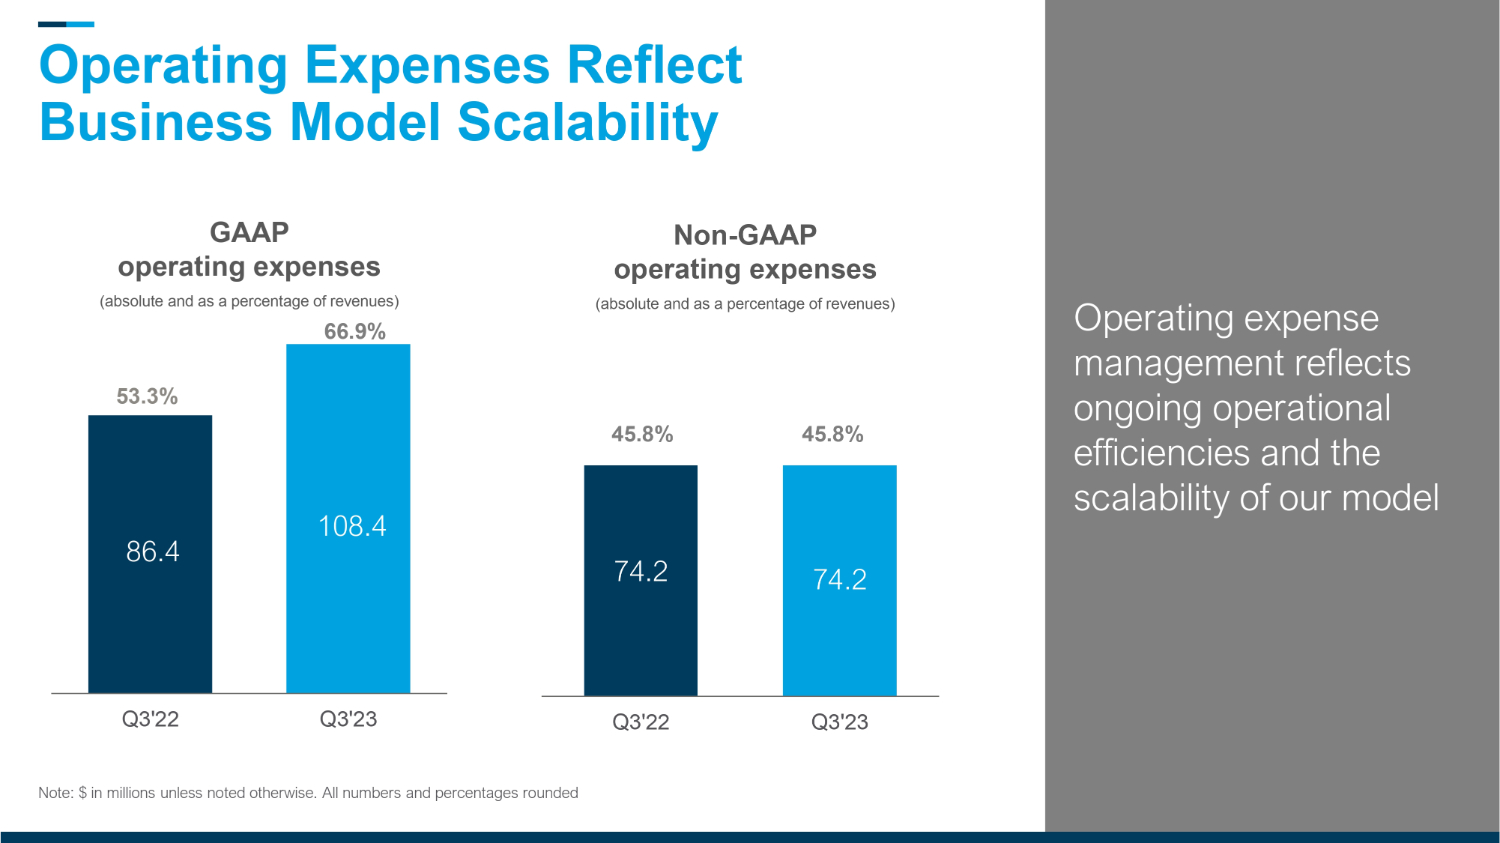
Operating Expenses Reflect Business Model Scalability GAAP operating expenses (absolute and as a percentage of revenues) Non - GAAP operating expenses (absolute and as a percentage of revenues) 86.4 108.4 Q3'22 Q3'23 66.9% 74.2 74.2 Q3'22 Q3'23 45.8% Note: $ in millions unless noted otherwise. All numbers and percentages rounded 53.3% 45.8% Operating expense management reflects ongoing operational efficiencies and the scalability of our model
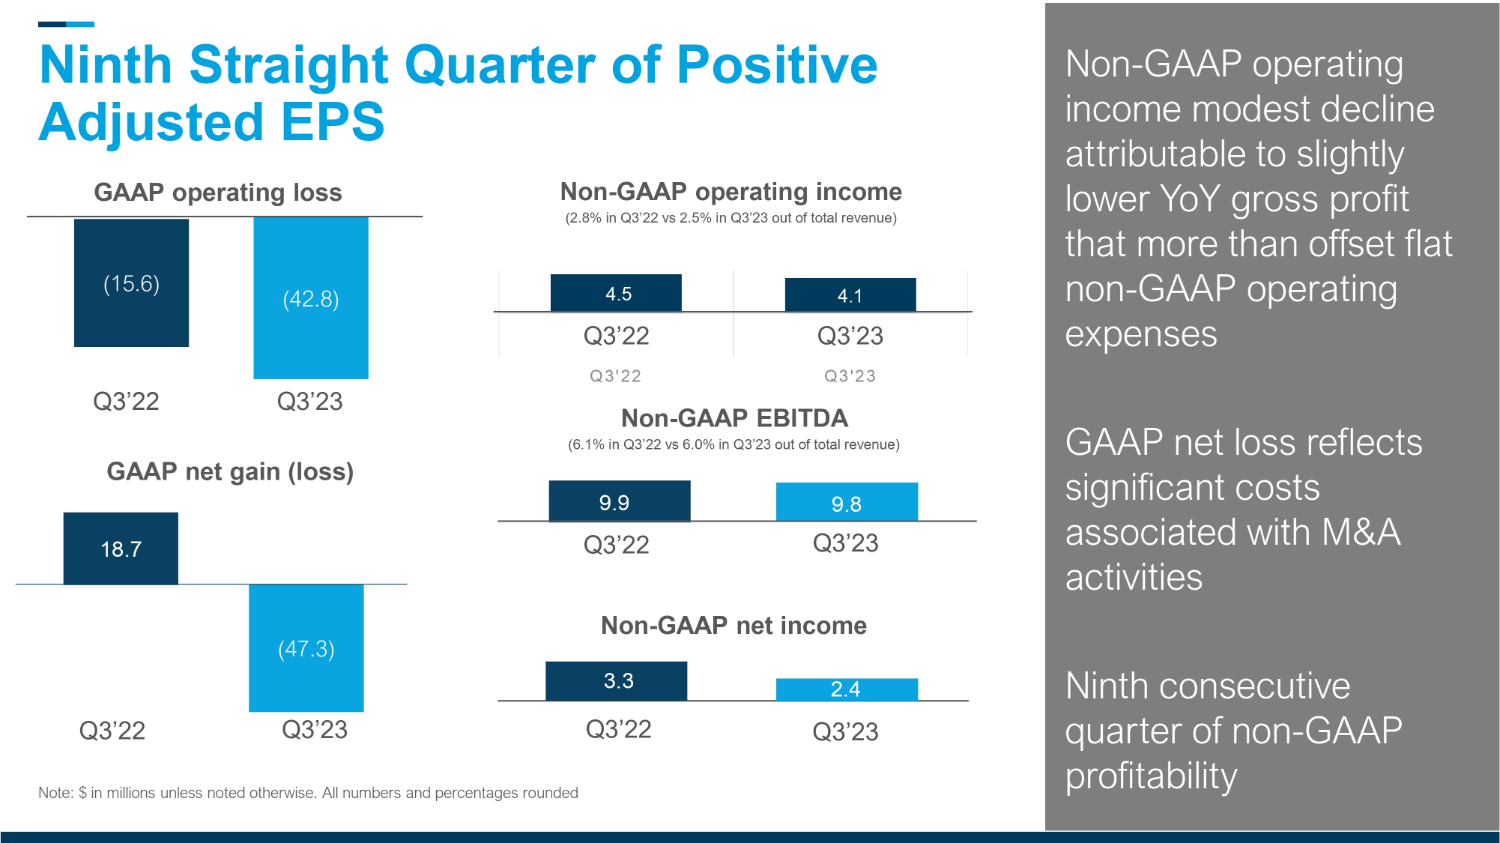
18.7 (47.3) (15.6) (42.8) Ninth Straight Quarter of Positive Adjusted EPS Non - GAAP operating income (2.8% in Q3’22 vs 2.5% in Q3’23 out of total revenue) GAAP operating loss Non - GAAP net income GAAP net gain ( loss) Note: $ in millions unless noted otherwise. All numbers and percentages rounded 4.5 4.1 Q 3 ' 22 Q3'23 Q3’22 Q3’23 Q3’22 Q3’23 Q3’22 Q3’23 Q 3 ’ 22 Q3’23 Q3’22 Q3’23 Non - GAAP operating income modest decline attributable to slightly lower YoY gross profit that more than offset flat non - GAAP operating expenses GAAP net loss reflects significant costs associated with M&A activities Ninth consecutive quarter of non - GAAP profitability 9.8 9.9 3.3 2.4 Non - GAAP EBITDA ( 6.1 % in Q 3 ’ 22 vs 0 % in Q 3 ’ 23 out of total revenue)
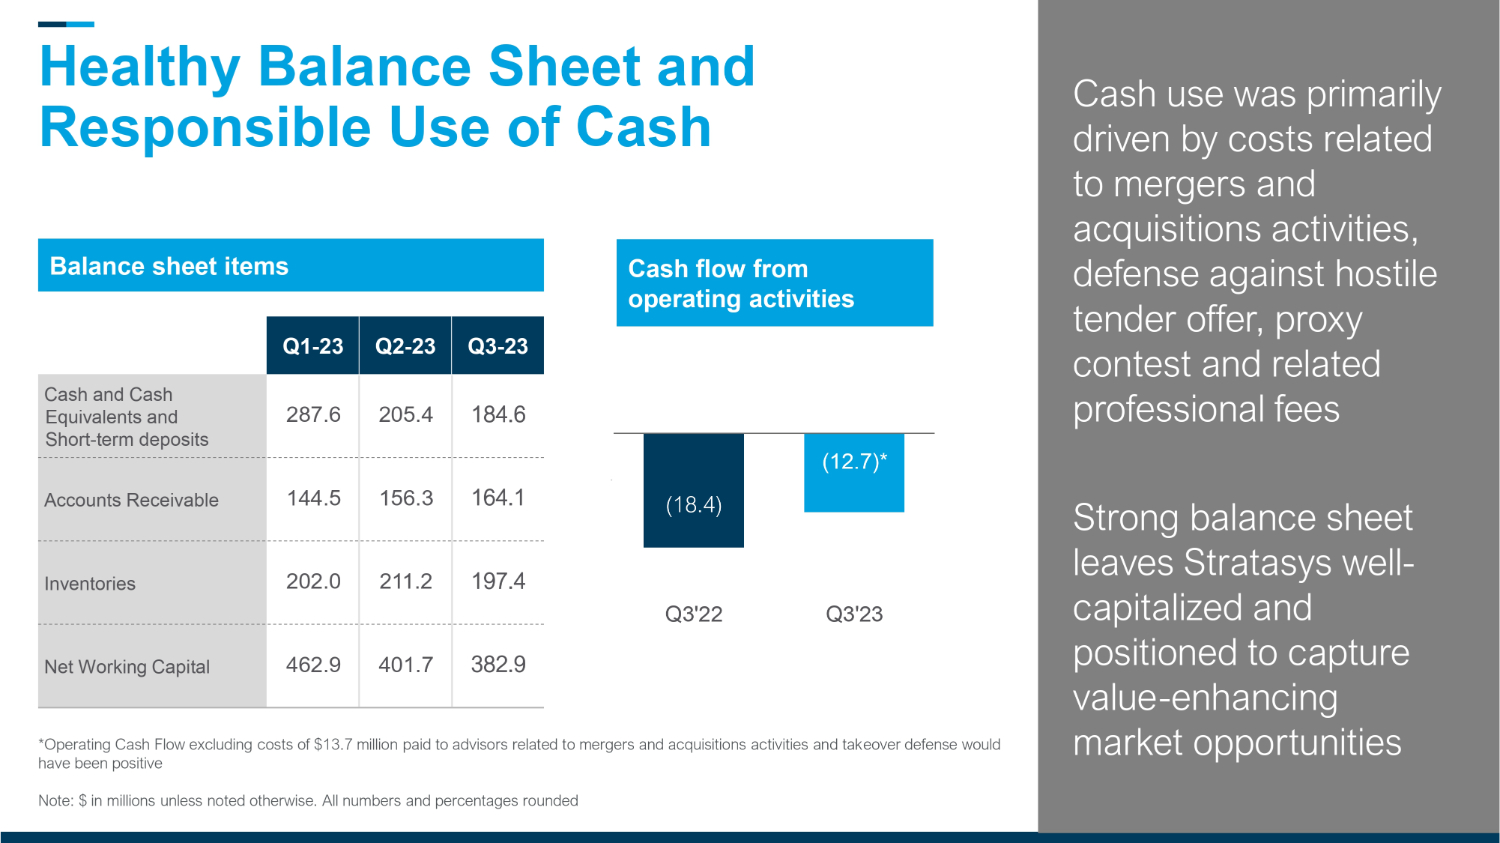
Healthy Balance Sheet and Responsible Use of Cash Balance sheet items (18.4) (12.7)* Q3'22 Q3'23 Cash flow from operating activities Q3 - 23 Q2 - 23 Q - 2 184.6 Cash and Cash Equivalents and Short - term deposits 164.1 Accounts Receivable 197.4 Inventories 382.9 ; Net Working Capital 16 Cash use was primarily driven by costs related to mergers and acquisitions activities, defense against hostile tender offer, proxy contest and related professional fees Strong balance sheet leaves Stratasys well - capitalized and positioned to capture value - enhancing market opportunities *Operating Cash Flow excluding costs of $13.7 million paid to advisors related to mergers and acquisitions activities and tak eov er defense would have been positive Note: $ in millions unless noted otherwise. All numbers and percentages rounded
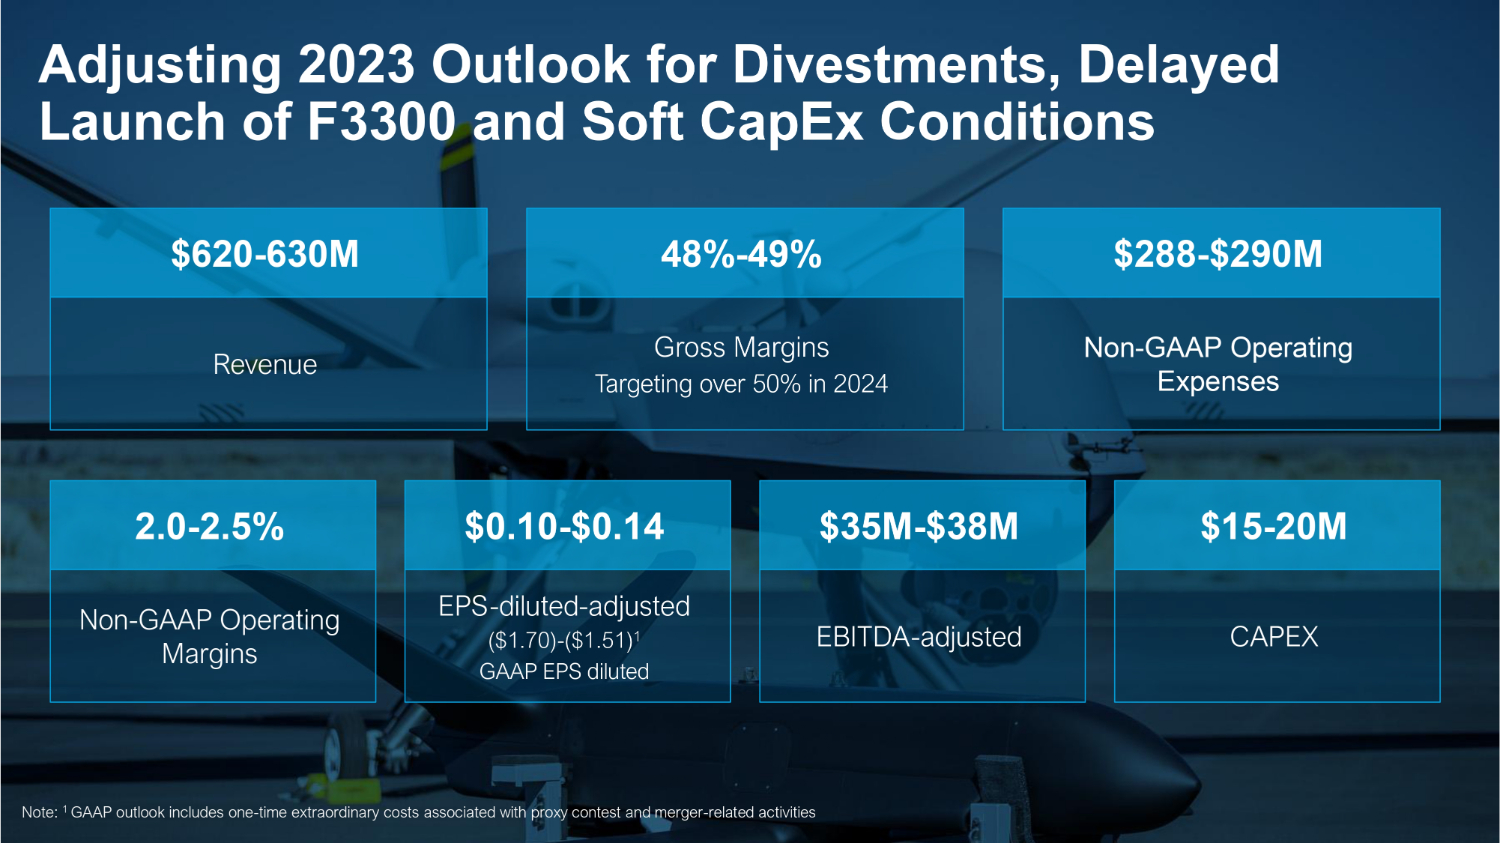
Revenue Gross Margins Targeting over 50% in 2024 Non - GAAP Operating Expenses Non - GAAP Operating Margins EPS - diluted - adjusted ($1.70) - ($1.51) 1 GAAP EPS diluted CAPEX EBITDA - adjusted Adjusting 2023 Outlook for Divestments, Delayed Launch of F3300 and Soft CapEx Conditions Note: 1 GAAP outlook includes one - time extraordinary costs associated with proxy contest and merger - related activities $620 - 630M 48% - 49% $288 - $290M 2.0 - 2.5% $ 0.10 - $ 0.14 $ 15 - 20 M $35M - $38M
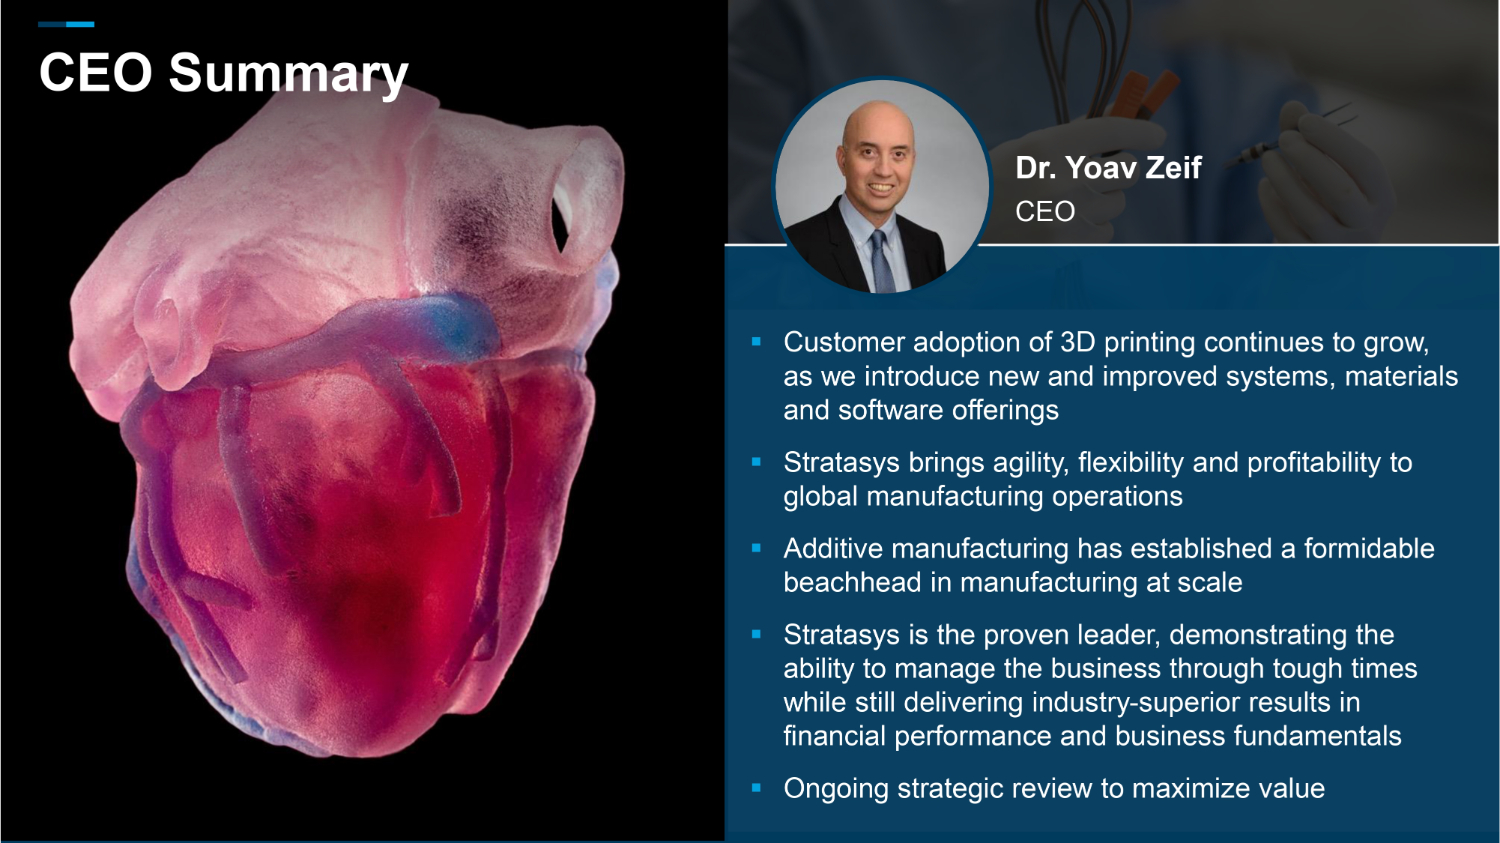
CEO Summary CEO Dr. Yoav Zeif ▪ Customer adoption of 3D printing continues to grow, as we introduce new and improved systems, materials and software offerings ▪ Stratasys brings agility, flexibility and profitability to global manufacturing operations ▪ Additive manufacturing has established a formidable beachhead in manufacturing at scale ▪ Stratasys is the proven leader, demonstrating the ability to manage the business through tough times while still delivering industry - superior results in financial performance and business fundamentals ▪ Ongoing strategic review to maximize value

Thank You
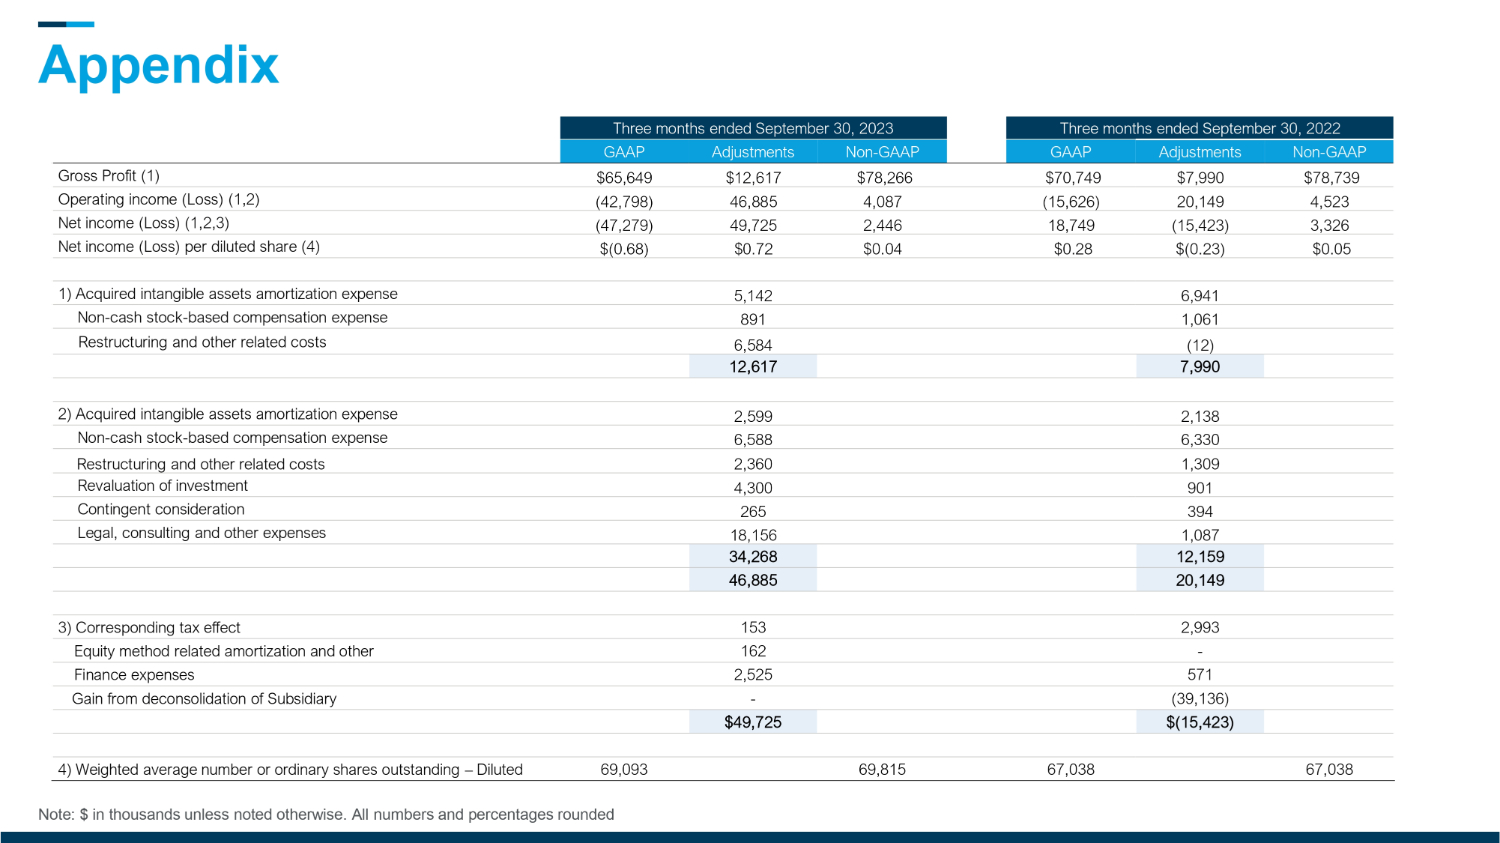
Appendix Note: $ in thousands unless noted otherwise. All numbers and percentages rounded Three months ended September 30 , 2022 Three months ended September 30 , 2023 Non - GAAP Adjustments GAAP Non - GAAP Adjustments GAAP $78,739 $7,990 $70,749 $78,266 $12,617 $65,649 Gross Profit (1) 4,523 20,149 (15,626) 4,087 46,885 (42,798) Operating income (Loss) (1,2) 3,326 (15,423) 18,749 2,446 49,725 (47,279) Net income (Loss) (1,2,3) $0.05 $(0.23) $ 0.28 $0.04 $0.72 $(0.68) Net income (Loss) per diluted share ( 4) 6,941 5,142 1) Acquired intangible assets amortization expense 1,061 891 Non - cash stock - based compensation expense (12) 6,584 Restructuring and other related costs 7,990 12,617 2,138 2,599 2) Acquired intangible assets amortization expense 6,330 6,588 Non - cash stock - based compensation expense 1,309 2,360 Restructuring and other related costs 901 4,300 Revaluation of investment 394 265 Contingent consideration 1,087 18,156 Legal, consulting and other expenses 12,159 34,268 20,149 46,885 2,993 153 3) Corresponding tax effect - 162 Equity method related amortization and other 571 2,525 Finance expenses (39,136) - Gain from deconsolidation of Subsidiary $(15,423) $49,725 67,038 67,038 69,815 69,093 4) Weighted average number or ordinary shares outstanding – Diluted