Exhibit 99.2
Q4 and FY2022 Results Speakers Dr. Yoav Zeif, CEO Eitan Zamir, CFO Yonah Lloyd, CCO & VP IR March 2, 2023
Conference Call and Webcast Details US Toll - Free Dial - In 1 - 877 - 407 - 0619 International Dial - In 1 - 412 - 902 - 1012 Live Webcast and Replay https://event.choruscall.com/mediaframe/webcast.htm l?webcastid=K6UFH5he 2 2
Forward - Looking Statements Cautionary Statement Regarding Forward - Looking Statements 3 3 The statements in this slide presentation regarding Stratasys' strategy, and the statements regarding its projected future financial performance, including the financial guidance concerning its expected results for 2023, are forward - looking statements reflecting management's current expectations and beliefs. These forward - looking statements are based on current information that is, by its nature, subject to rapid and even abrupt change. Due to risks and uncertainties associated with Stratasys' business, actual results could differ materially from those projected or implied by these forward - looking statements. These risks and uncertainties include, but are not limited to: the degree of our success at introducing new or improved products and solutions that gain market share; the extent of growth of the 3D printing market generally; the duration and severity of headwinds caused by current macro - economic trends that have been adversely affecting, and may continue to adversely affect, our results, including unfavorable currency exchange rates, supply - chain delays, inflationary pressures and rising interest rates; the impact of potential shifts in the prices or margins of the products that we sell or services that we provide, including due to a shift towards lower margin products or services; the impact of competition and new technologies; the extent of our success at successfully integrating into our existing business, or making additional, acquisitions or investments in new businesses, technologies, products or services; potential changes in our management and board of directors; global market, political and economic conditions, and in the countries in which we operate in particular (including risks stemming from Russia’s invasion of Ukraine); potential further charges against earnings that we could be required to take due to impairment of additional goodwill or other intangible assets that we have recently acquired or may acquire in the future; costs and potential liability relating to litigation and regulatory proceedings; risks related to infringement of our intellectual property rights by others or infringement of others' intellectual property rights by us; the extent of our success at maintaining our liquidity and financing our operations and capital needs; the impact of tax regulations on our results of operations and financial condition; and those additional factors referred to in Item 3.D “Key Information - Risk Factors”, Item 4, “Information on the Company”, Item 5, “Operating and Financial Review and Prospects,” and all other parts of our Annual Report on Form 20 - F for the year ended December 31, 2022, to be filed with the SEC on or about March 2, 2023 (the “2022 Annual Report”). Readers are urged to carefully review and consider the various disclosures made throughout our 2022 Annual Report and the Reports of Foreign Private Issuer on Form 6 - K that attach Stratasys’ unaudited, condensed consolidated financial statements and its review of its results of operations and financial condition, for the quarterly periods throughout 2023, which Stratasys will be furnishing to the SEC over the course of 2023, and our other reports filed with or furnished to the SEC, which are designed to advise interested parties of the risks and factors that may affect our business, financial condition, results of operations and prospects. Any guidance provided, and other forward - looking statements made, in this slide presentation are made as of the date hereof, and Stratasys undertakes no obligation to publicly update or revise any forward - looking statements, whether as a result of new information, future events or otherwise, except as required by law.
Use of Non - GAAP Financial Information Use of Non - GAAP Financial Measures The non - GAAP data included herein, which excludes certain items as described below, are non - GAAP financial measures. Our management believes that these non - GAAP financial measures are useful information for investors and shareholders of our Company in gauging our results of operations (i) on an ongoing basis after excluding mergers, acquisitions and divestments related expense or gains and reorganization - related charges or gains, legal provisions, and (ii) excluding non - cash items such as stock - based compensation expenses, acquired intangible assets amortization, including intangible assets amortization related to equity method investments, impairment of long - lived assets and goodwill, revaluation of our investments and the corresponding tax effect of those items. The items eliminated via these non - GAAP adjustments either do not reflect actual cash outlays that impact our liquidity and our financial condition or have a non - recurring impact on the statement of operations, as assessed by management. These non - GAAP financial measures are presented to permit investors to more fully understand how management assesses our performance for internal planning and forecasting purposes. The limitations of using these non - GAAP financial measures as performance measures are that they provide a view of our results of operations without including all items indicated above during a period, which may not provide a comparable view of our performance to other companies in our industry. Investors and other readers should consider non - GAAP measures only as supplements to, not as substitutes for or as superior measures to, the measures of financial performance prepared in accordance with GAAP. Reconciliation between results on a GAAP and non - GAAP basis is provided in a table later in this slide presentation. 4
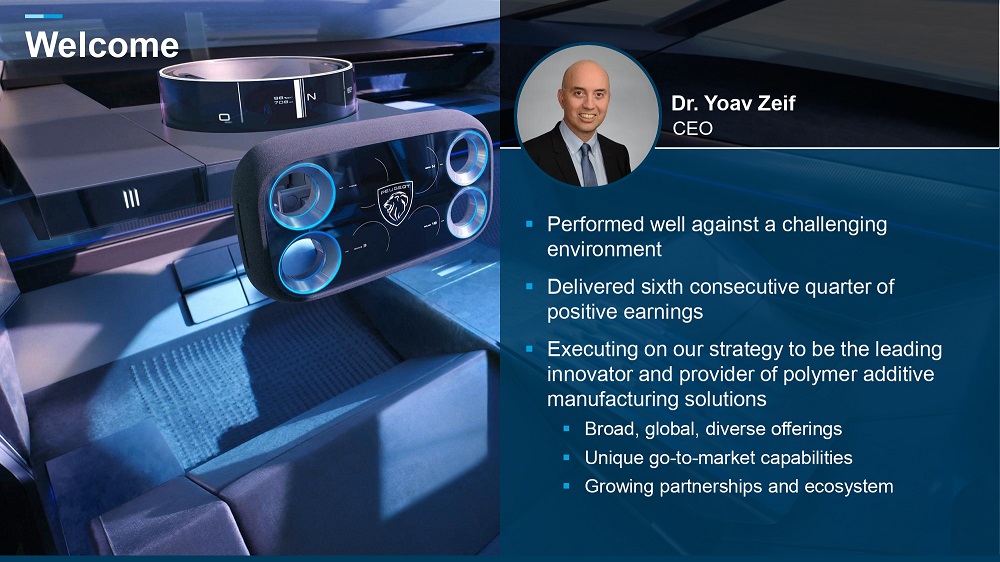
Welcome ▪ Performed well against a challenging environment ▪ Delivered sixth consecutive quarter of positive earnings ▪ Executing on our strategy to be the leading innovator and provider of polymer additive manufacturing solutions ▪ Broad, global, diverse offerings ▪ Unique go - to - market capabilities ▪ Growing partnerships and ecosystem CEO Dr. Yoav Zeif
6 Full Year Summary ▪ Revenue growth of 7.3% y/y, or 11.4% adjusted for MakerBot and constant currency ▪ Gross margin slightly higher than 2021 and poised to grow ▪ Manufacturing contributed 32.5% of total revenues ▪ Adjusted EPS of $0.15 ▪ Strong balance sheet with no debt
Helping Customers Succeed in a Challenging Environment 7 ▪ Uncertain economy still affecting purchase behavior - Sales cycles are longer with some order deferrals ▪ Business benefits of 3D printing – production efficiency, better products, reduced logistics costs, faster time to market – becomes more apparent in times like these ▪ 2022 recurring revenue growth reflects the value of our systems ▪ Consumables up 7.7%, adjusted for MakerBot and constant currency ▪ Customer support up 11.0%, adjusted for constant currency
We Executed On Our Growth Strategy in 2022 Investments for Growth ▪ Riven acquisition – AI software ▪ Axial3D investment – AI medical cloud software ▪ Covestro AM acquisition (closure expected in Q2’23) ▪ MakerBot - Ultimaker – immediately accretive Materials Innovations ▪ First Validated 3 rd party materials for FDM printers ▪ Open Materials License for FDM and Origin P3 printers ▪ Advanced Antero material for space applications ▪ Anatomic modeling material for CT scans and other images GrabCAD Software Expansion ▪ Customers with multiple technologies across a single software platform ▪ New SDK partners ▪ GrabCAD Print expansion to H350, Origin One, and Origin One Dental printers
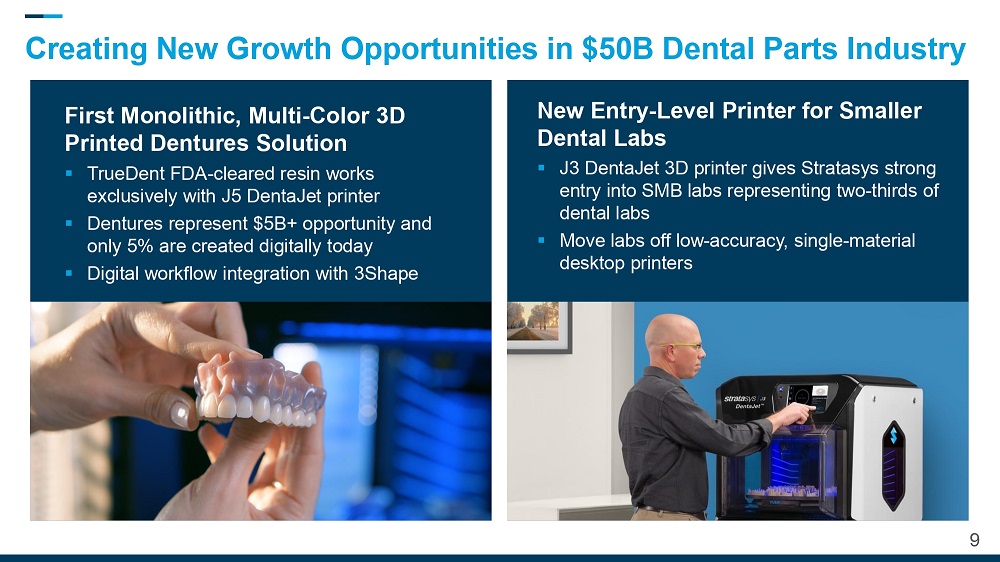
9 Creating New Growth Opportunities in $50B Dental Parts Industry First Monolithic, Multi - Color 3D Printed Dentures Solution ▪ TrueDent FDA - cleared resin works exclusively with J5 DentaJet printer ▪ Dentures represent $5B+ opportunity and only 5% are created digitally today ▪ Digital workflow integration with 3Shape New Entry - Level Printer for Smaller Dental Labs ▪ J3 DentaJet 3D printer gives Stratasys strong entry into SMB labs representing two - thirds of dental labs ▪ Move labs off low - accuracy, single - material desktop printers
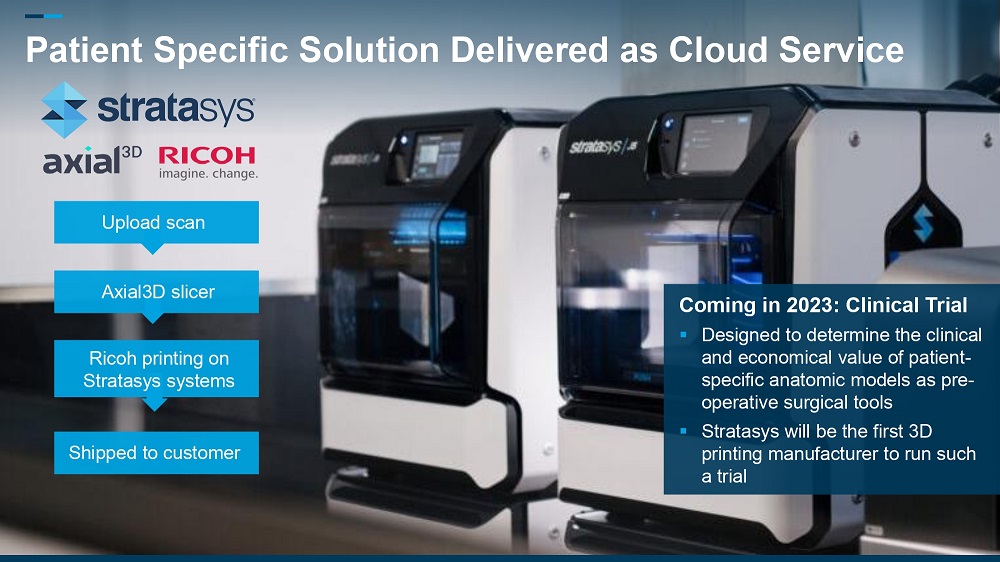
Coming in 2023: Clinical Trial ▪ Designed to determine the clinical and economical value of patient - specific anatomic models as pre - operative surgical tools ▪ Stratasys will be the first 3D printing manufacturer to run such a trial Patient Specific Solution Delivered as Cloud Service Shipped to customer Axial3D slicer Upload scan Ricoh printing on Stratasys systems
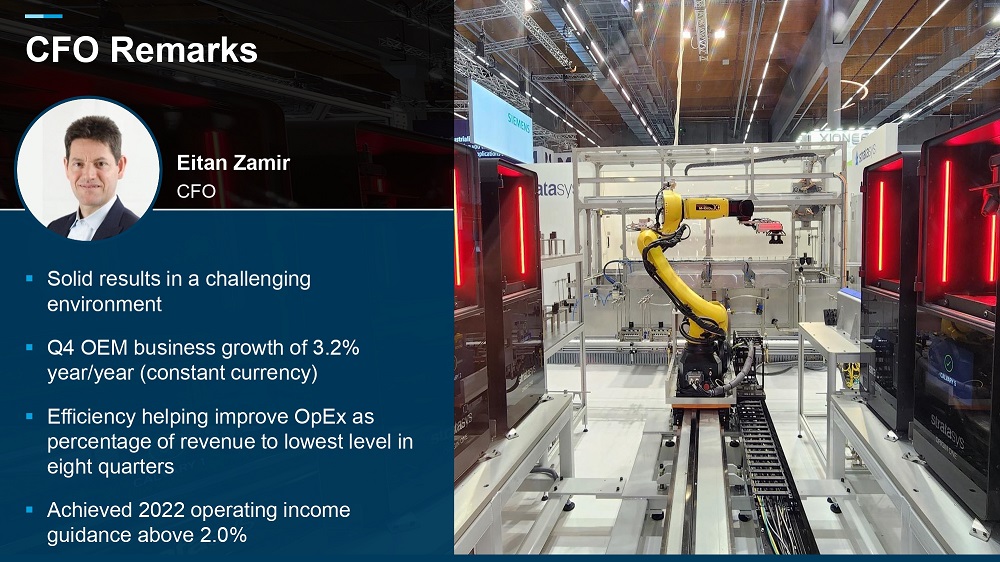
▪ Solid results in a challenging environment ▪ Q4 OEM business growth of 3.2% year/year (constant currency) ▪ Efficiency helping improve OpEx as percentage of revenue to lowest level in eight quarters ▪ Achieved 2022 operating income guidance above 2.0% CFO Eitan Zamir CFO Remarks
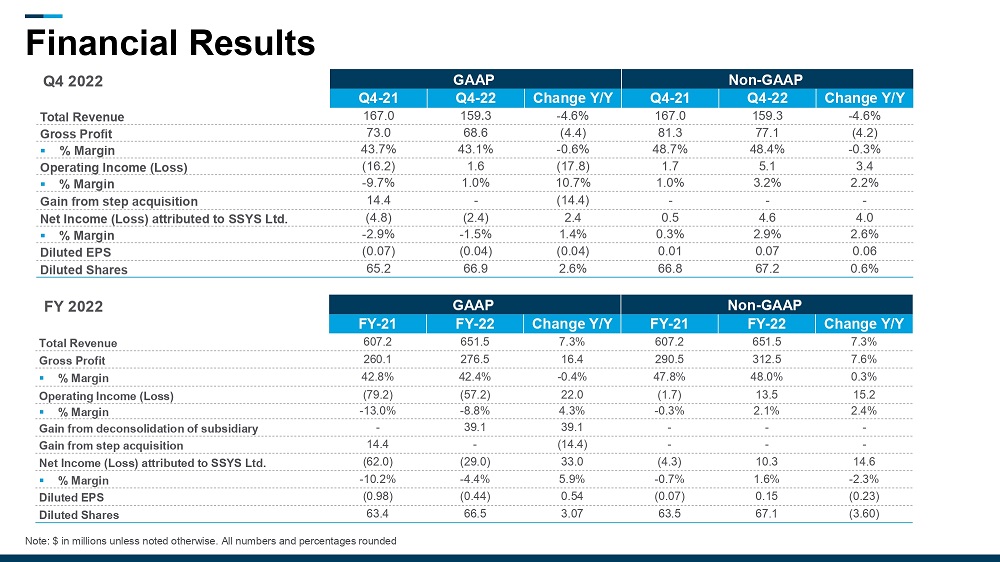
Financial Results Note: $ in millions unless noted otherwise. All numbers and percentages rounded GAAP Non - GAAP Q4 - 21 Q4 - 22 Change Y/Y Q4 - 21 Q - 22 Change Y/Y Total Revenue 167.0 159 3 - 4.6% 167.0 159.3 - 4.6% Gross Profit 73.0 68 . 6 (4 . 4) 81.3 77.1 (4.2) ▪ % Margin 43.7% 4 .1 % - 0 . 6% 48.7% 48.4% - 0 . 3% Operating Income (Loss) (16.2) 1.6 (17 . 8) 1.7 5.1 3.4 ▪ % Margin - 9.7% 1.0% 10 . 7% 1.0% 3.2% 2.2% Gain from step acquisition 14.4 - (14.4) - - - Net Income (Loss) attributed to SSYS Ltd. (4.8) (2.4) 2.4 0.5 4.6 4.0 ▪ % Margin - 2.9% - 1.5% 1.4% 0.3% 2.9% 2.6% Diluted EPS (0.07) (0.04) (0.04) 0.01 0.07 0.06 Diluted Shares 6 5 . 2 6 6 . 9 2.6% 66.8 67.2 0.6% GAAP Non - GAAP FY - 21 FY - 22 Change Y/Y FY - 21 FY - 22 Change Y/Y Total Revenue 607.2 651 5 7.3% 607.2 651.5 7.3% Gross Profit 260.1 76 . 5 16 . 4 290.5 312.5 7 . 6% ▪ % Margin 42.8% 4 .4 % - 0 . 4% 47.8% 48.0% 0 . 3% Operating Income (Loss) (79.2) (57.2) 22.0 (1.7) 13.5 15.2 ▪ % Margin - 13.0% - 8.8% 4 . 3% - 0.3% 2.1% 2.4% Gain from deconsolidation of subsidiary - 39.1 39.1 - - - Gain from step acquisition 14.4 - (14.4) - - - Net Income (Loss) attributed to SSYS Ltd. (62.0) (29.0) 33.0 (4.3) 10.3 14.6 ▪ % Margin - 10.2% - % % - 0.7% 1.6% - 2.3% Diluted EPS (0.98) (0.44) 0.54 (0.07) 0.15 (0.23) Diluted Shares 63.4 6 6 . 5 3.07 63.5 67.1 (3.60) Q 4 2022 FY 2022
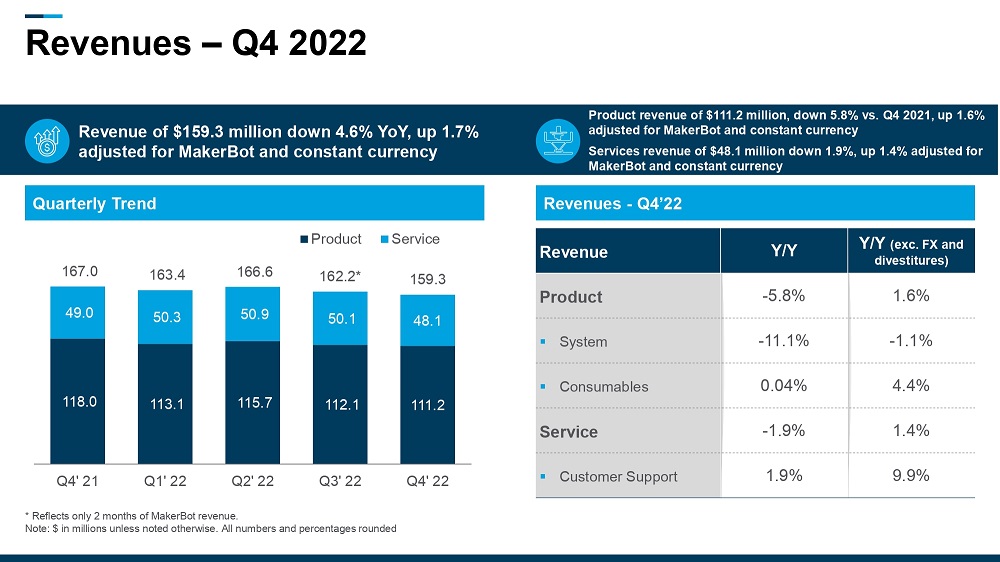
Revenues – Q4 2022 * Reflects only 2 months of MakerBot revenue. Note: $ in millions unless noted otherwise. All numbers and percentages rounded Quarterly Trend Revenues - Q4’22 118.0 113.1 115.7 112.1 111.2 49.0 50.3 50.9 50.1 48.1 167.0 163.4 166.6 162.2* 159.3 Q4' 21 Q1' 22 Q2' 22 Q3' 22 Q4' 22 Product Service Revenue Y/Y Y/Y (exc. FX and divestitures) Product - 5 . 8 % 1 . 6 % ▪ System - 11 . 1 % - 1 . 1 % ▪ Consumables 0.04% .4 % Service - 1.9% . % ▪ Customer Support 1.9% . % Revenue of $159.3 million down 4.6 % YoY, up 1.7% adjusted for MakerBot and constant currency Product revenue of $ 111.2 million, down 5.8 % vs. Q 4 2021 , up 1.6 % adjusted for MakerBot and constant currency S ervices revenue of $ 48.1 million down 1.9 %, up 1.4 % adjusted for MakerBot and constant currency
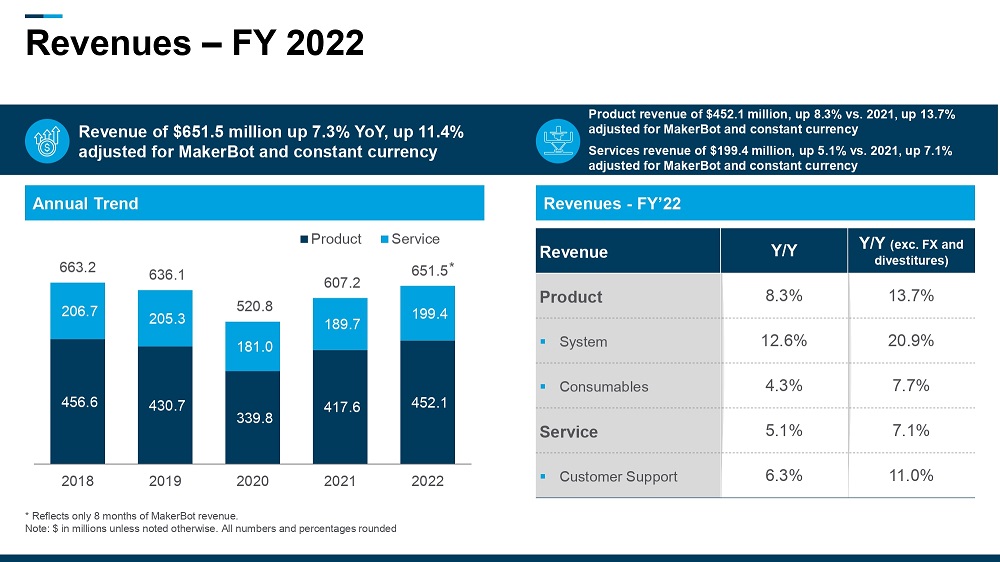
Revenues – FY 2022 * Reflects only 8 months of MakerBot revenue. Note: $ in millions unless noted otherwise. All numbers and percentages rounded Annual Trend 456.6 430.7 339.8 417.6 452.1 206.7 205.3 181.0 189.7 199.4 663.2 636.1 520.8 607.2 651.5 2018 2019 2020 2021 2022 Product Service Revenue of $651.5 million up 7 .3 % YoY, up 11.4% adjusted for MakerBot and constant currency Product revenue of $452.1 million, up 8.3% vs. 2021, up 13.7% adjusted for MakerBot and constant currency S ervices revenue of $199.4 million, up 5 .1 % vs. 2021, up 7 .1 % adjusted for MakerBot and constant currency * Revenues - FY’22 Revenue Y/Y Y/Y (exc. FX and divestitures) Product 8.3 % 13 . 7 % ▪ System 12 . 6 % 20 . 9 % ▪ Consumables 4.3% 7.7% Service 5.1% 7.1% ▪ Customer Support 6.3% 11 . 0 %
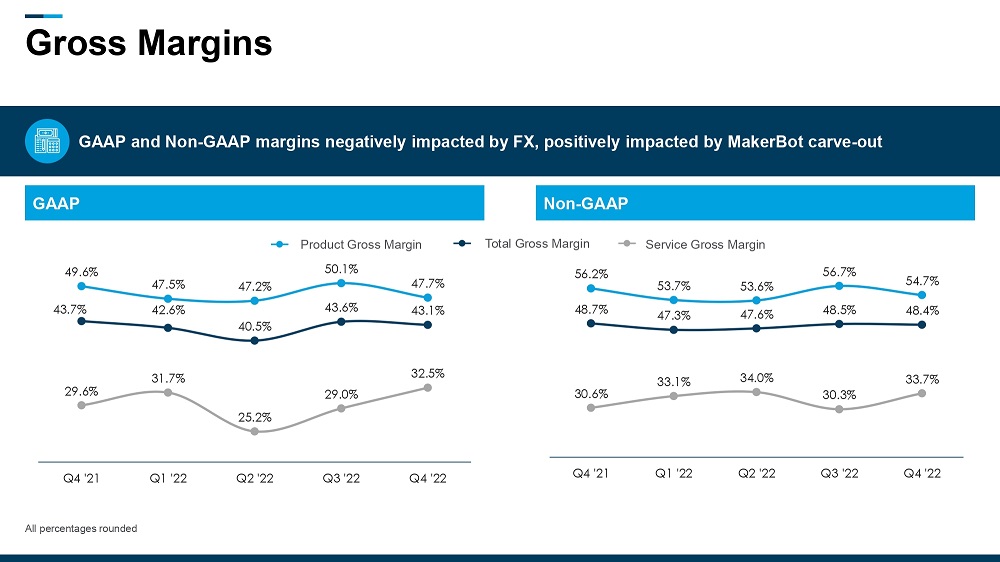
Gross Margins GAAP Non - GAAP 43.7% 42.6% 40.5% 43.6% 43.1% 49.6% 47.5% 47.2 % 50.1% 47.7% 29.6% 31.7% 25.2% 29.0% 32.5% Q4 '21 Q1 '22 Q2 '22 Q3 '22 Q4 '22 48.7 % 47.3% 47.6% 48.5% 48.4% 56.2% 53.7% 53.6% 56.7 % 54.7% 30.6% 33.1% 34.0% 30.3% 33.7% Q4 '21 Q1 '22 Q2 '22 Q3 '22 Q4 '22 Service Gross Margin Product Gross Margin Total Gross Margin All percentages rounded GAAP and Non - GAAP margins negatively impacted by FX, positively impacted by MakerBot carve - out
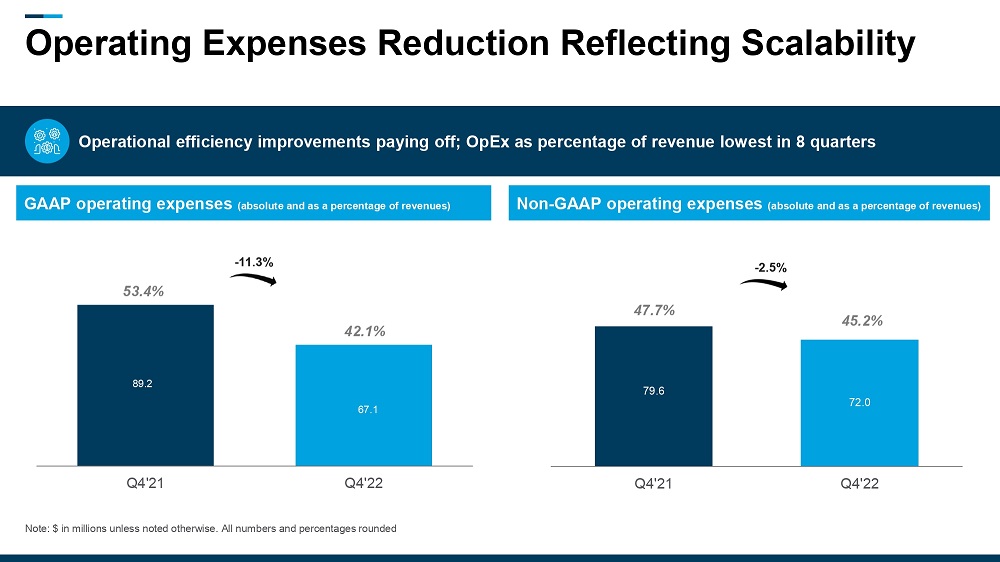
Operating Expenses Reduction Reflecting Scalability GAAP operating expenses (absolute and as a percentage of revenues) Non - GAAP operating expenses (absolute and as a percentage of revenues) Operational efficiency improvements paying off; OpEx as percentage of revenue lowest in 8 quarters 89.2 67.1 Q4'21 Q4'22 42.1% - 11.3% 79.6 72.0 Q4'21 Q4'22 45.2% - 2.5% Note: $ in millions unless noted otherwise. All numbers and percentages rounded 53.4% 47.7%
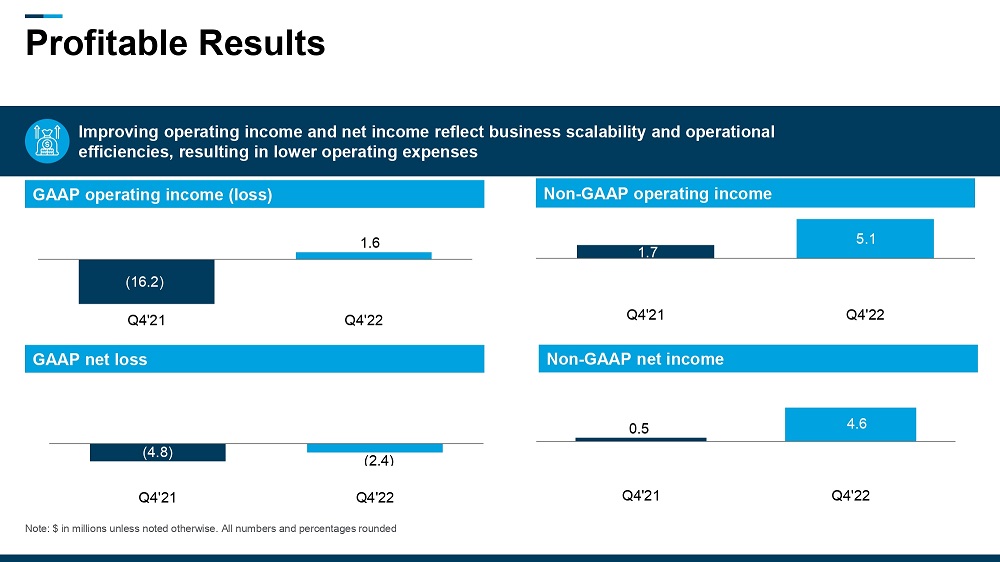
Profitable Results Note: $ in millions unless noted otherwise. All numbers and percentages rounded GAAP operating income (loss) Non - GAAP operating income Improving operating income and net income reflect business scalability and operational efficiencies, resulting in lower operating expenses GAAP net loss Non - GAAP net income 1.7 5.1 Q4'21 Q4'22 ( 16.2 ) 1.6 Q4'21 Q4'22 0.5 4.6 Q4'21 Q4'22 (4.8) (2.4) Q4'21 Q4'22
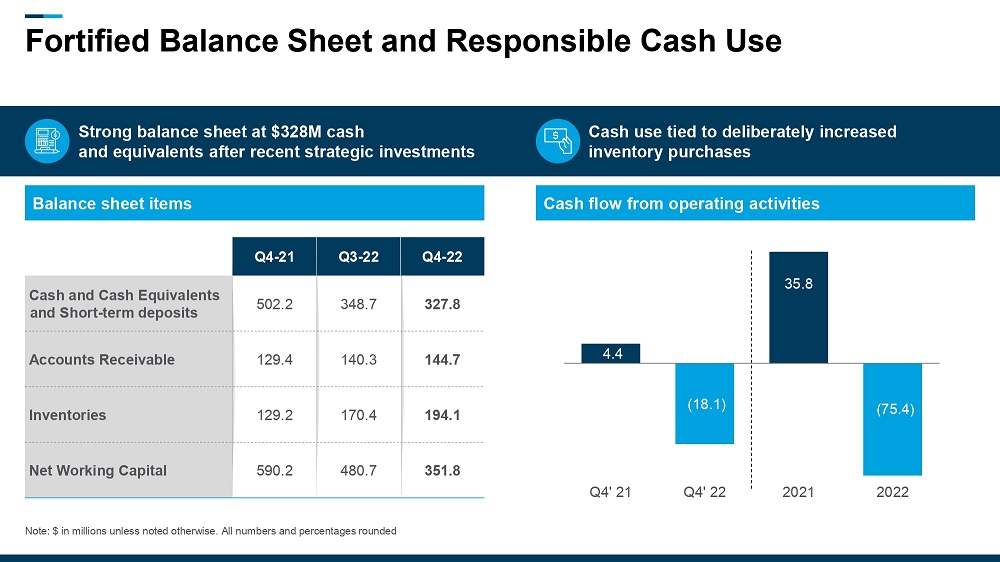
Fortified Balance Sheet and Responsible Cash Use Note: $ in millions unless noted otherwise. All numbers and percentages rounded Strong balance sheet at $328M cash and equivalents after recent strategic investments Cash use tied to deliberately increased inventory purchases Balance sheet items Cash flow from operating activities Q 4 - 21 Q3 - 22 Q4 - 22 Cash and Cash Equivalents and Short - term deposits 502.2 348 7 327.8 Accounts Receivable 129.4 40 144.7 Inventories 129.2 170 4 194.1 Net Working Capital 590.2 480.7 351.8 4.4 (18.1) 35.8 Q4' 21 Q4' 22 2021 2022 (75.4)
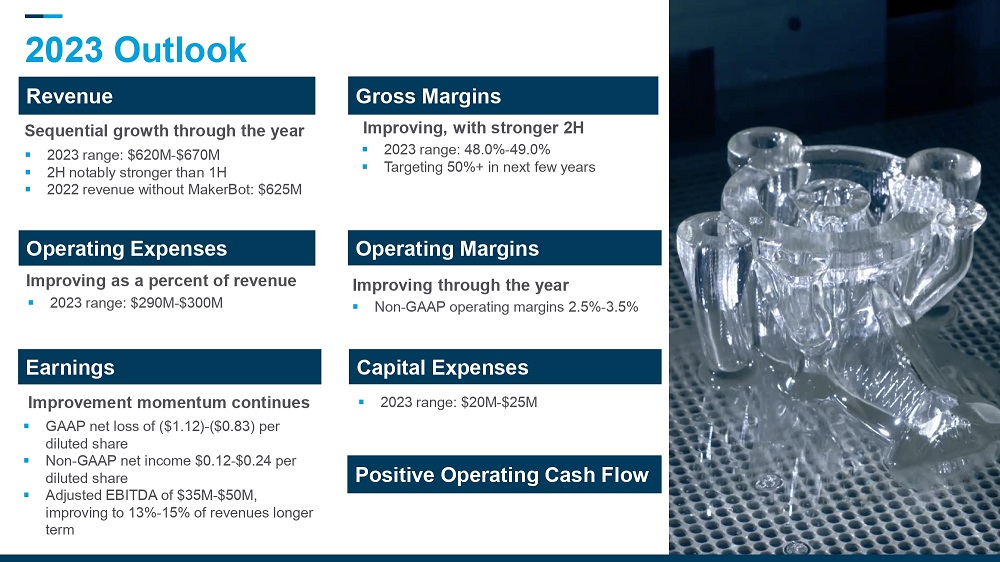
2023 Outlook ▪ 2023 range: $290M - $300M Operating Expe nses Gross Margins ▪ 2023 range: 48.0% - 49.0% ▪ Targeting 50%+ in next few years ▪ GAAP net loss of ($1.12) - ($0.83) per d iluted share ▪ Non - GAAP net income $0.12 - $0.24 per diluted share ▪ Adjusted EBITDA of $35M - $ 50 M, improving to 13% - 15% of revenues longer term Earnings ▪ 2023 range: $620M - $670M ▪ 2H notably stronger than 1H ▪ 2022 revenue without MakerBot: $625M Revenue Operating Margins ▪ Non - GAAP operating margins 2 .5% - 3.5% 1 9 Capital Expenses Positive Operating Cash Flow Sequential growth through the year Improving, with stronger 2H Improving as a percent of revenue I mproving through the year ▪ 2023 range: $20M - $25M Improvement momentum continues
▪ Profitable growth with a sharpened focus on core OEM offerings ▪ Today’s business challenges reinforce additive manufacturing’s benefits ▪ Balance sheet strength to continue to invest in hardware, materials and software to broaden our market presence ▪ Relentless focus on execution and investment for growth, profitability and shareholder value CEO Summary CEO Dr. Yoav Zeif
Thank You 2 1
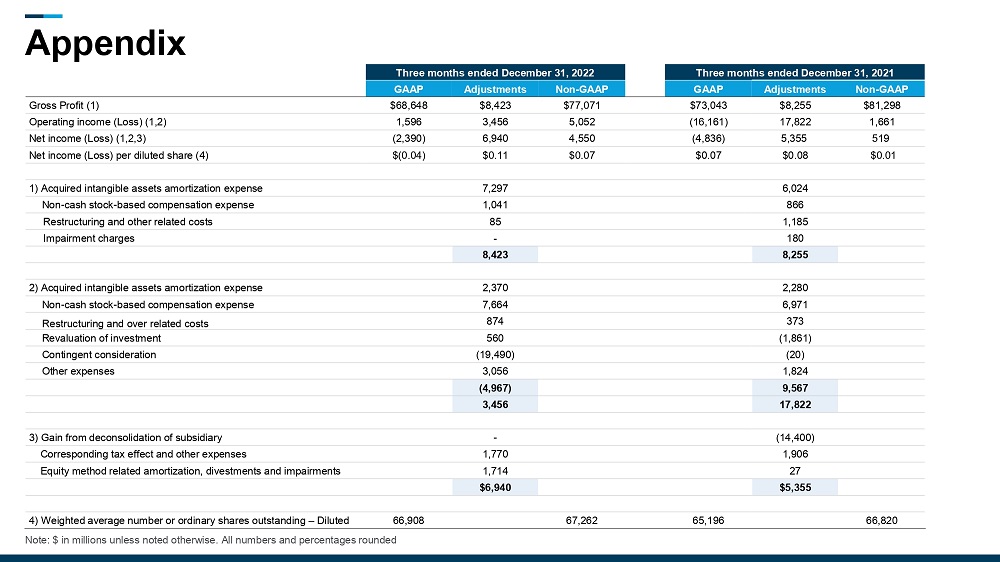
Appendix Note: $ in millions unless noted otherwise. All numbers and percentages rounded Three months ended December 31 , 2022 Three months ended December 31, 2021 GAAP Adjustments Non - GAAP GAAP Adjustments Non - GAAP Gross Profit (1) $ 68,648 $ 8,423 $ , $ 73,043 $ 8,255 $ 81,298 Operating income (Loss) (1,2) 1,596 3,456 5,052 ( , 61 ) , 22 1,661 Net income (Loss) (1,2,3) ( 2,390 ) 6,940 4,550 ( 4,836 ) 5,355 9 Net income (Loss) per diluted share ( 4) ) $ 11 $ 0.07 $ 0.08 1) Acquired intangible assets amortization expense 7,297 6,024 Non - cash stock - based compensation expense 1,041 866 Restructuring and other related costs 85 1,185 Impairment charges 180 8 423 8,255 2) Acquired intangible assets amortization expense 2,370 2,280 Non - cash stock - based compensation expense 7,664 6,971 Restructuring and over related costs 874 373 Revaluation of investment 560 (1,861) Contingent consideration (19,490) (20) Other expenses 3,056 1,824 (4,967) 9,567 3,456 17,822 3) Gain from deconsolidation of subsidiary - (14,400) Corresponding tax effect and other expenses 1,770 1,906 Equity method related amortization, divestments and impairments 1,714 27 $6,940 $5,355 4) Weighted average number or ordinary shares outstanding – Diluted 66,908 67,262 65,196 66,820