Exhibit 99.2

Q3 2022 Results Speakers Dr. Yoav Zeif, CEO Eitan Zamir, CFO Yonah Lloyd, CCO & VP IR Nov. 10, 2022
Conference Call and Webcast Details US Toll - Free Dial - In 1 - 877 - 407 - 0629 International Dial - In 1 - 412 - 902 - 1012 Live Webcast and Replay https://event.choruscall.com/mediaframe/webcast.htm l?webcastid=Aau6uFJK 2 2
Forw a rd - Looking Statements Cautionary Statement Regarding Forward - Looking Statements The statements in this slide presentation regarding Stratasys' strategy, and the statements regarding its projected future financial performance, including the financial guidance concerning its expected results for 2022, are forward - looking statements reflecting management's current expectations and beliefs. These forward - looking statements are based on current information that is, by its nature, subject to rapid and even abrupt change. Due to risks and uncertainties associated with Stratasys' business, actual results could differ materially from those projected or implied by these forward - looking statements. These risks and uncertainties include, but are not limited to: the degree of our success at introducing new or improved products and solutions that gain market share; the extent of growth of the 3D printing market generally; the duration and severity of the macro - economic trends triggered by the global COVID - 19 pandemic, such as supply - chain delays, inflationary pressures and rising interest rates; the impact of potential shifts in the prices or margins of the products that we sell or services that we provide, including due to a shift towards lower margin products or services; the impact of competition and new technologies; the extent of our success at successfully integrating into our existing business, or making additional, acquisitions or investments in new businesses, technologies, products or services; potential changes in our management and board of directors; global market, political and economic conditions, and in the countries in which we operate in particular (including risks stemming from Russia’s invasion of Ukraine); potential further charges against earnings that we could be required to take due to impairment of additional goodwill or other intangible assets that we have recently acquired or may acquire in the future; costs and potential liability relating to litigation and regulatory proceedings; risks related to infringement of our intellectual property rights by others or infringement of others' intellectual property rights by us; the extent of our success at maintaining our liquidity and financing our operations and capital needs; the impact of tax regulations on our results of operations and financial condition; and those additional factors referred to in Item 3.D “Key Information - Risk Factors”, Item 4, “Information on the Company”, Item 5, “Operating and Financial Review and Prospects,” and all other parts of our Annual Report on Form 20 - F for the year ended December 31, 2021, filed with the SEC on February 24, 2022 (the “2021 Annual Report”). Readers are urged to carefully review and consider the various disclosures made throughout our 2021 Annual Report and the Reports of Foreign Private Issuer on Form 6 - K that attach Stratasys’ unaudited, condensed consolidated financial statements and its review of its results of operations and financial condition, for the quarterly periods throughout 2022, which Stratasys has furnished to the SEC over the course of 2022, and our other reports filed with or furnished to the SEC, which are designed to advise interested parties of the risks and factors that may affect our business, financial condition, results of operations and prospects. Any guidance provided, and other forward - looking statements made, in this slide presentation are made as of the date hereof, and Stratasys undertakes no obligation to publicly update or revise any forward - looking statements, whether as a result of new information, future events or otherwise, except as required by law. 3 2
Use of Non - GAAP Financial Information Use of Non - GAAP Financial Measures The non - GAAP data included herein, which excludes certain items as described below, are non - GAAP financial measures. Our management believes that these non - GAAP financial measures are useful information for investors and shareholders of our Company in gauging our results of operations (i) on an ongoing basis after excluding mergers, acquisitions and divestments related expense or gains and reorganization - related charges or gains, legal provisions, and (ii) excluding non - cash items such as stock - based compensation expenses, acquired intangible assets amortization, including intangible assets amortization related to equity method investments, impairment of long - lived assets and goodwill, revaluation of our investments and the corresponding tax effect of those items. These non - GAAP adjustments either do not reflect actual cash outlays that impact our liquidity and our financial condition or have a non - recurring impact on the statement of operations, as assessed by management. These non - GAAP financial measures are presented to permit investors to more fully understand how management assesses our performance for internal planning and forecasting purposes. The limitations of using these non - GAAP financial measures as performance measures are that they provide a view of our results of operations without including all items indicated above during a period, which may not provide a comparable view of our performance to other companies in our industry. Investors and other readers should consider non - GAAP measures only as supplements to, not as substitutes for or as superior measures to, the measures of financial performance prepared in accordance with GAAP. Reconciliation between results on a GAAP and non - GAAP basis is provided in a table later in this slide presentation. 4 2
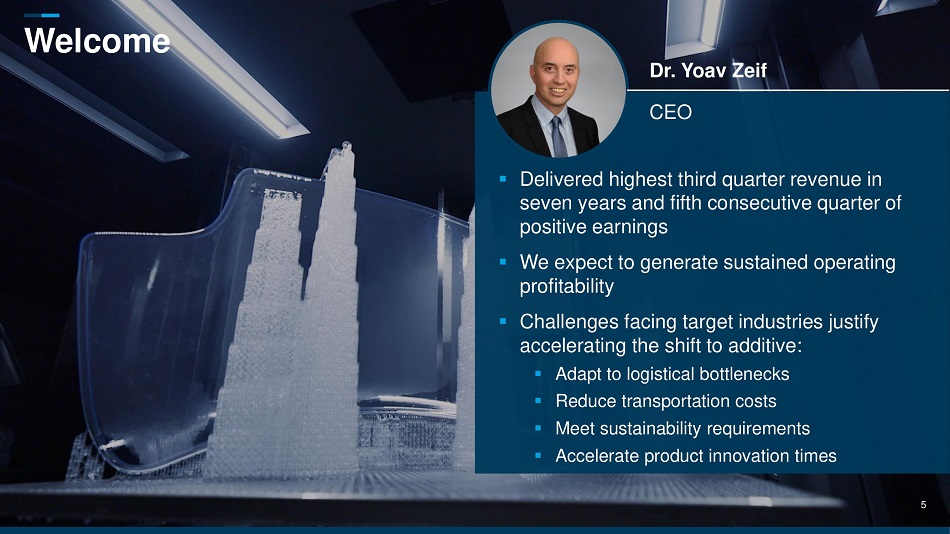
W elcome Dr. Yoav Zeif CEO ▪ Delivered highest third quarter revenue in seven years and fifth consecutive quarter of positive earnings ▪ We expect to generate sustained operating profitability ▪ Challenges facing target industries justify accelerating the shift to additive: ▪ Adapt to logistical bottlenecks ▪ Reduce transportation costs ▪ Meet sustainability requirements ▪ Accelerate product innovation times 5
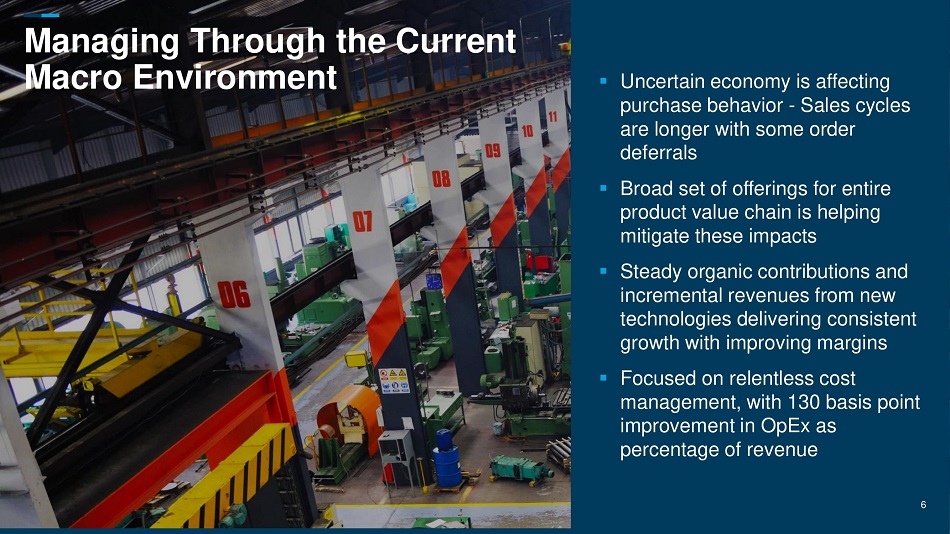
Managing Through the Current Macro Environment ▪ Uncertain economy is affecting purchase behavior - Sales cycles are longer with some order deferrals ▪ Broad set of offerings for entire product value chain is helping mitigate these impacts ▪ Steady organic contributions and incremental revenues from new technologies delivering consistent growth with improving margins ▪ Focused on relentless cost management, with 130 basis point improvement in OpEx as percentage of revenue 6 6
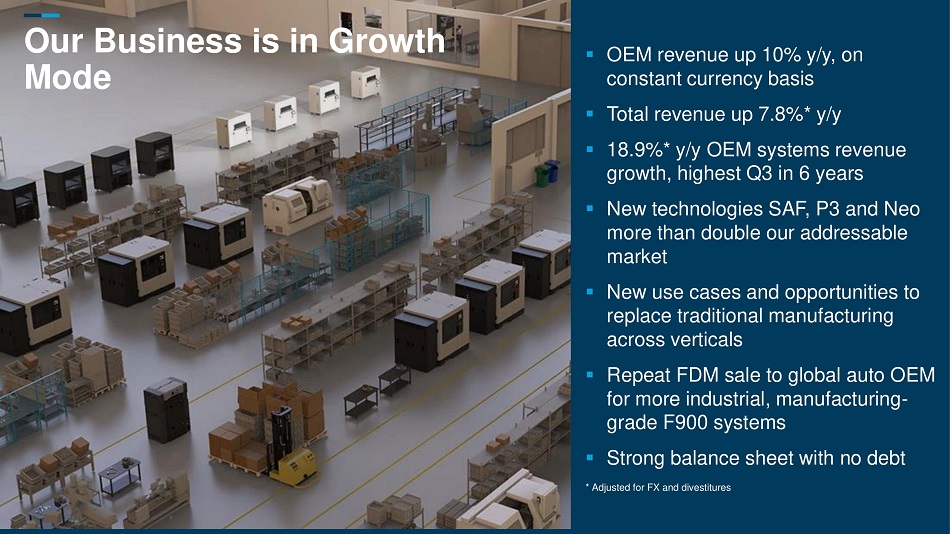
Our Business is in Growth Mode ▪ OEM revenue up 10% y/y, on constant currency basis ▪ Total revenue up 7.8%* y/y ▪ 18.9%* y/y OEM systems revenue growth, highest Q3 in 6 years ▪ New technologies SAF, P3 and Neo more than double our addressable market ▪ New use cases and opportunities to replace traditional manufacturing across verticals ▪ Repeat FDM sale to global auto OEM for more industrial, manufacturing - grade F900 systems ▪ Strong balance sheet with no debt * Adjusted for FX and divestitures
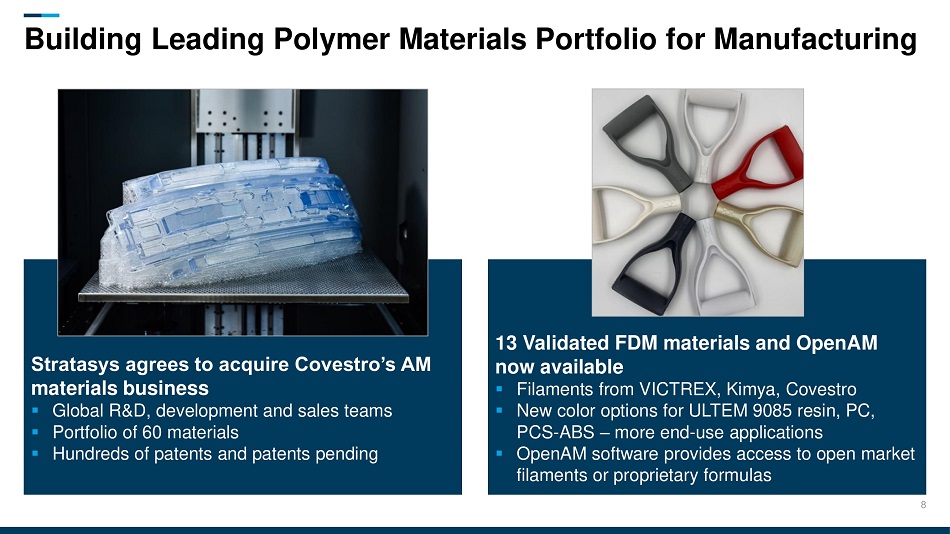
Stratasys agrees to acquire Covestro’s AM materials business ▪ Global R&D, development and sales teams ▪ Portfolio of 60 materials ▪ Hundreds of patents and patents pending Building Leading Polymer Materials Portfolio for Manufacturing 13 Validated FDM materials and OpenAM now available ▪ Filaments from VICTREX, Kimya, Covestro ▪ New color options for ULTEM 9085 resin, PC, PCS - ABS – more end - use applications ▪ OpenAM software provides access to open market filaments or proprietary formulas 8
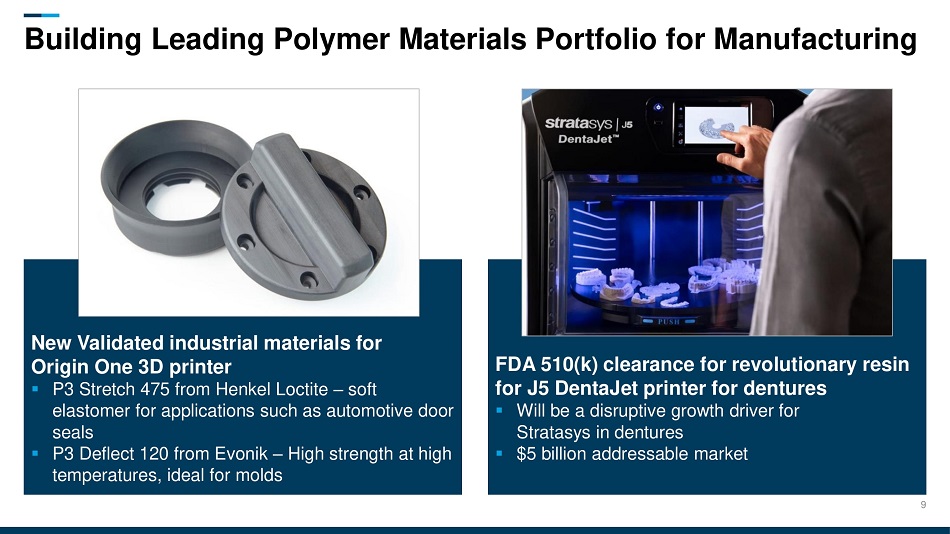
New Validated industrial materials for Origin One 3D printer ▪ P3 Stretch 475 from Henkel Loctite – soft elastomer for applications such as automotive door seals ▪ P3 Deflect 120 from Evonik – High strength at high temperatures, ideal for molds FDA 510(k) clearance for revolutionary resin for J5 DentaJet printer for dentures ▪ Will be a disruptive growth driver for Stratasys in dentures ▪ $5 billion addressable market Building Leading Polymer Materials Portfolio for Manufacturing 9
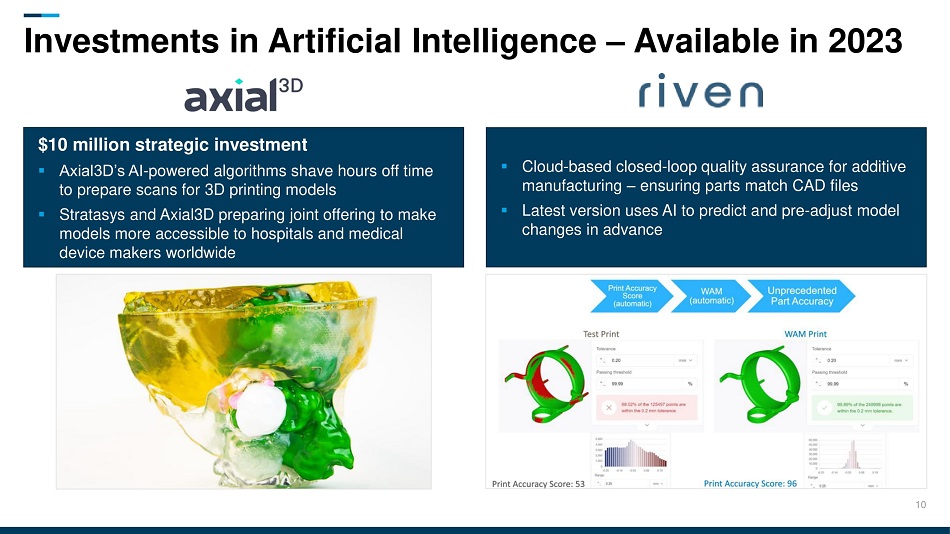
Investments in Artificial Intelligence – Available in 2023 $10 million strategic investment ▪ Axial3D’s AI - powered algorithms shave hours off time to prepare scans for 3D printing models ▪ Stratasys and Axial3D preparing joint offering to make models more accessible to hospitals and medical device makers worldwide ▪ Cloud - based closed - loop quality assurance for additive manufacturing – ensuring parts match CAD files ▪ Latest version uses AI to predict and pre - adjust model changes in advance 10
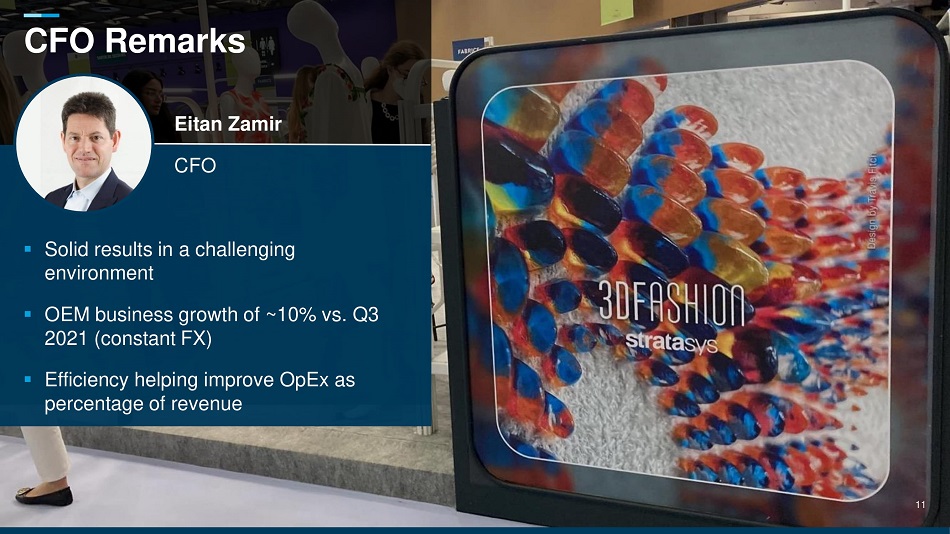
▪ Solid results in a challenging environment ▪ OEM business growth of ~10% vs. Q3 2021 (constant FX) ▪ Efficiency helping improve OpEx as percentage of revenue Eitan Zamir CFO CFO Remarks 11
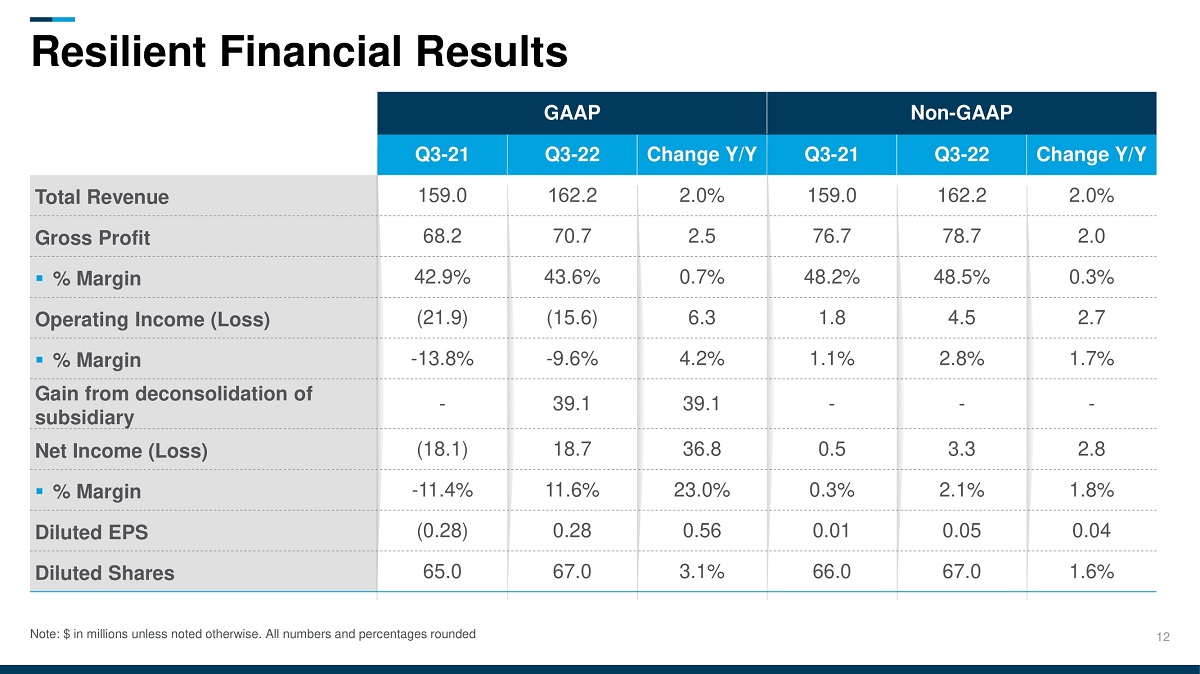
Resilient Financial Results GAAP Non - GAAP Q 3 - 21 Q3 - 22 Change Y/Y Q3 - 21 Q3 - 22 Change Y/Y Total Revenue 159.0 162.2 2.0% 159.0 162.2 2.0% Gross Profit 68.2 70.7 2.5 76.7 78.7 2.0 ▪ % Margin 42.9% 43.6% 0.7% 48.2% 48.5% 0.3% Operating Income (Loss) (21.9) (15.6) 6.3 1.8 4.5 2.7 ▪ % Margin - 13.8% - 9.6% 4.2% 1.1% 2.8% 1.7% Gain from deconsolidation of subsidiary - 39.1 39.1 - - - Net Income (Loss) (18.1) 18.7 36.8 0.5 3.3 2.8 ▪ % Margin - 1 1.4% 11.6% 23.0% 0.3% 2.1% 1.8% Diluted EPS (0.28) 0.28 0.56 0.01 0.05 0.04 Diluted Shares 65.0 67.0 3.1% 66.0 67.0 1.6% Note: $ in millions unless noted otherwise. All numbers and percentages rounded 12
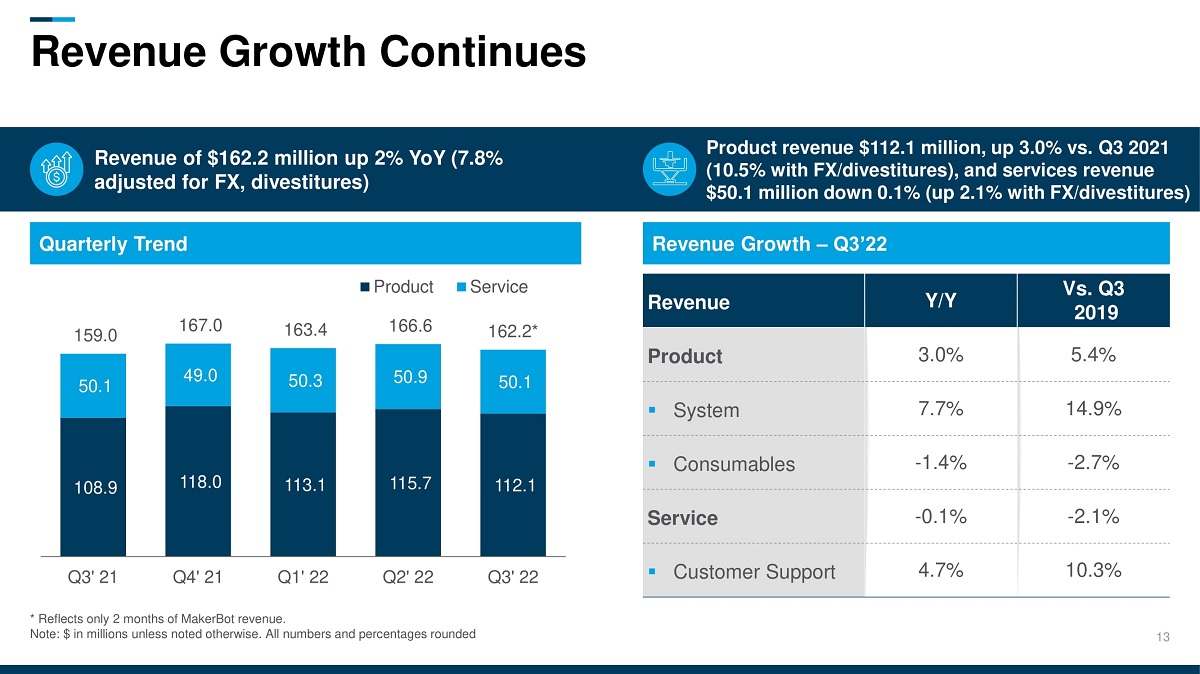
Revenue Growth Continues Q3' 21 Q4' 21 Q1' 22 * Reflects only 2 months of MakerBot revenue. Quarterly Trend Revenue Growth – Q3’22 108.9 1 18.0 1 13.1 1 15.7 1 12.1 50.1 49.0 50.3 50.9 50.1 159.0 167.0 163.4 166.6 162.2* Q2' 22 Q3' 22 Product Service Revenue Y/Y Vs. Q3 2019 Product 3.0% 5.4% ▪ System 7.7% 14.9% ▪ Consumables - 1.4% - 2.7% Service - 0.1% - 2.1% ▪ Customer Support 4.7% 10.3% Revenue of $162.2 million up 2% YoY (7.8% adjusted for FX, divestitures) Product revenue $112.1 million, up 3.0% vs. Q3 2021 (10.5% with FX/divestitures), and services revenue $50.1 million down 0.1% (up 2.1% with FX/divestitures) Note: $ in millions unless noted otherwise. All numbers and percentages rounded 13
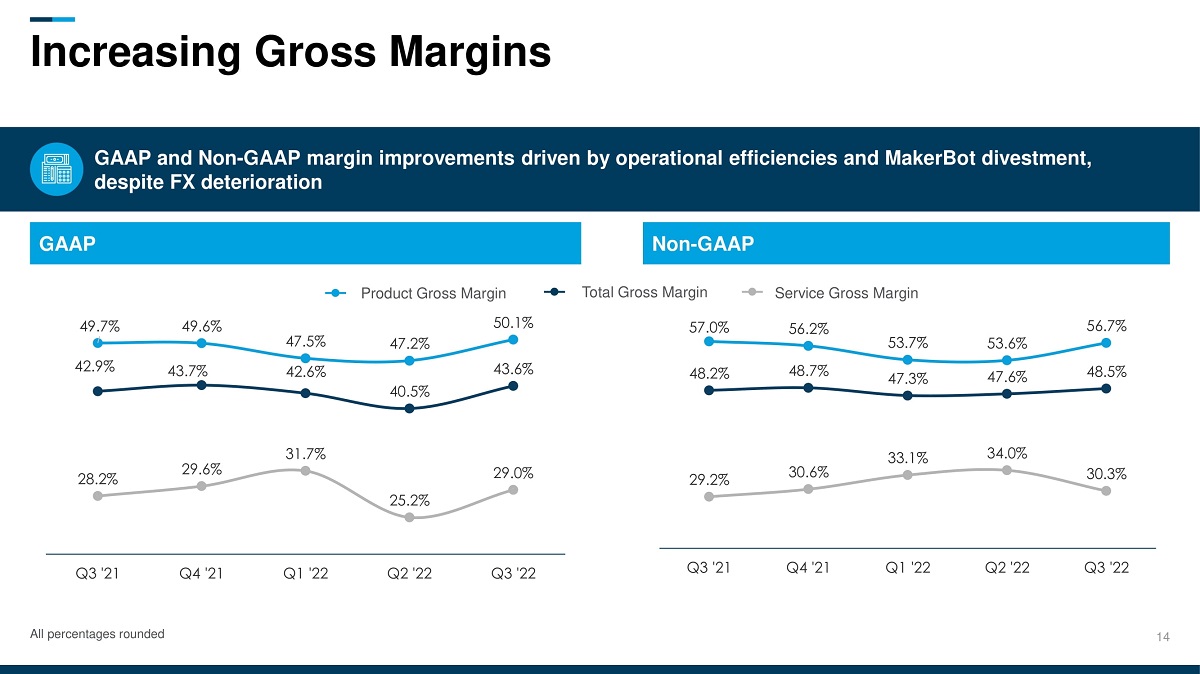
Increasing Gross Margins 14 GAAP Non - GAAP GAAP and Non - GAAP margin improvements driven by operational efficiencies and MakerBot divestment, despite FX deterioration 42.9 % 43 . 7% 40 . 5% 43.6 % 49 . 7% 49 . 6% 47 . 5% 42 . 6% Product Gross Margin 50 . 1% 47.2% 28 . 2% 29 . 6% 31 . 7% 25 . 2% 29 . 0% Q3 '21 Q4 '21 Q1 '22 Q2 '22 Q3 '22 48 . 2% 48 . 7% 47 . 3% 47 . 6% 48.5 % 57 . 0% 56 . 2% 53 . 7% 53.6 % 56 . 7% 29 . 2% 30 . 6% 33.1 % 34.0 % 30 . 3% Q3 '21 Q4 '21 Q1 '22 Q2 '22 Q3 '22 Total Gross Margin Service Gross Margin All percentages rounded
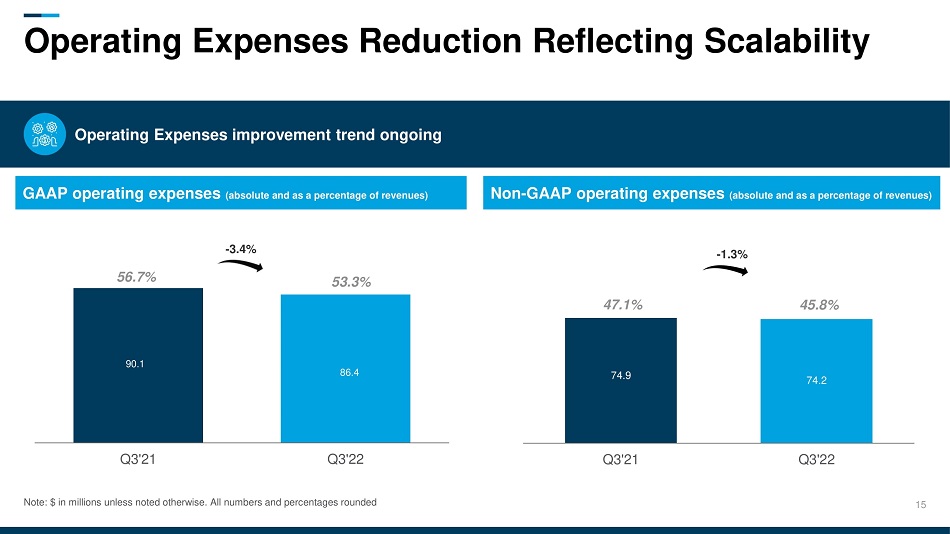
Operating Expenses Reduction Reflecting Scalability GAAP operating expenses (absolute and as a percentage of revenues) Non - GAAP operating expenses (absolute and as a percentage of revenues) Operating Expenses improvement trend ongoing 90.1 86.4 Q3'21 Q3 ' 22 53.3% - 3.4% 56.7% 74 . 9 74 . 2 Q3 ' 21 Q3 ' 22 45.8% - 1 . 3 % 47.1% Note: $ in millions unless noted otherwise. All numbers and percentages rounded 15
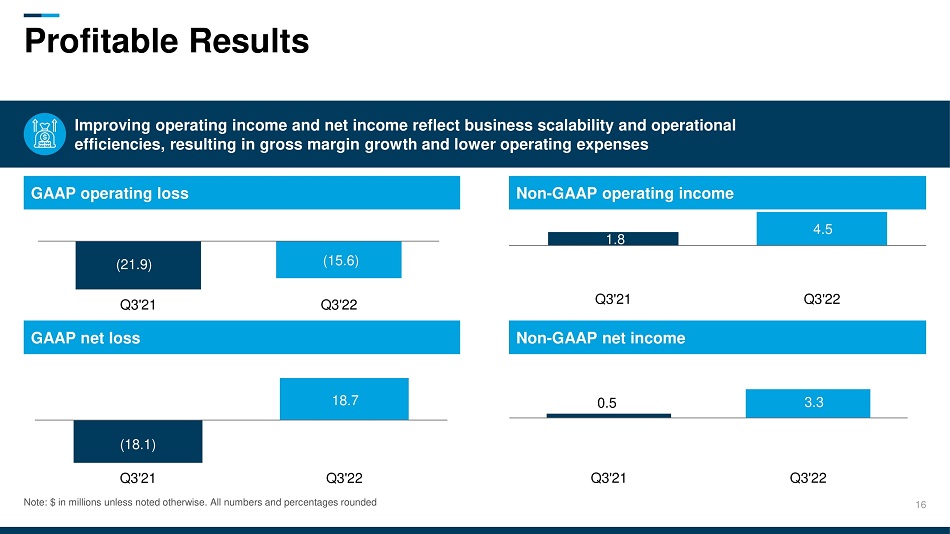
Profitable Results GAAP operating loss Non - GAAP operating income Improving operating income and net income reflect business scalability and operational efficiencies, resulting in gross margin growth and lower operating expenses (21.9) (15.6) Q3 ' 21 Q3 ' 22 1.8 4.5 Q3 ' 21 Q3 ' 22 GAAP net loss Non - GAAP net income 18.7 0.5 3.3 (18.1) Q3 ' 21 Q3'22 Q3'21 Q3'22 Note: $ in millions unless noted otherwise. All numbers and percentages rounded 16
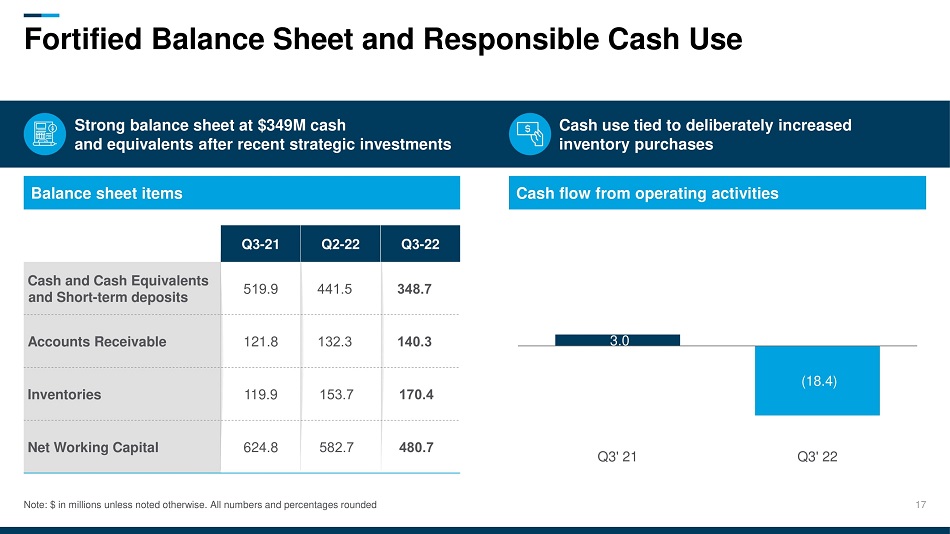
Fortified Balance Sheet and Responsible Cash Use Strong balance sheet at $349M cash and equivalents after recent strategic investments Cash use tied to deliberately increased inventory purchases Balance sheet items Cash flow from operating activities 3.0 (18.4) Q3' 21 Q3' 22 Q3 - 21 Q2 - 22 Q3 - 22 Cash and Cash Equivalents and Short - term deposits 519.9 441.5 348.7 Accounts Receivable 121.8 132.3 140.3 Inventories 119.9 153.7 170.4 Net Working Capital 624.8 582.7 480.7 Note: $ in millions unless noted otherwise. All numbers and percentages rounded 17
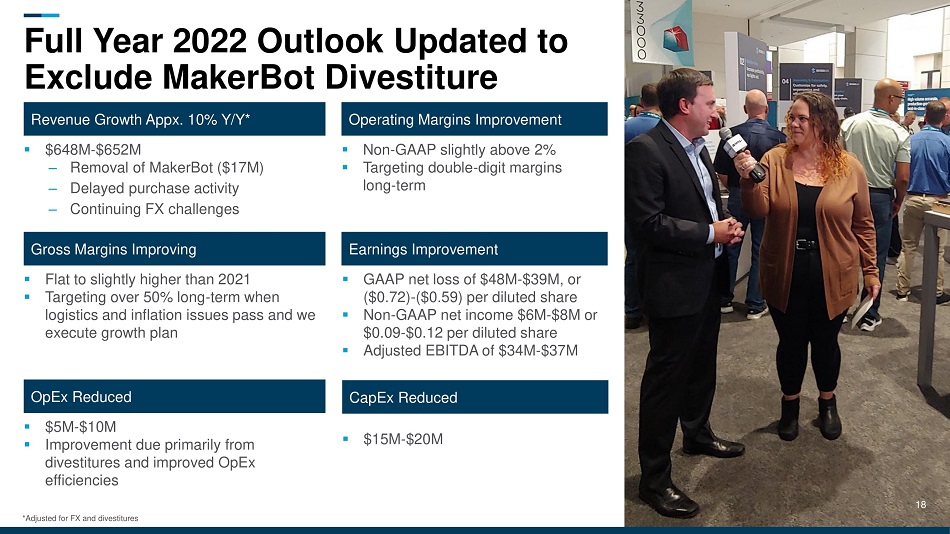
Full Year 2022 Outlook Updated to Exclude MakerBot Divestiture 18 *Adjusted for FX and divestitures ▪ $ 5 M - $ 10 M ▪ Improvement due primarily from divestitures and improved OpEx efficiencies OpEx Reduced Gross Margins Improving ▪ Flat to slightly higher than 2021 ▪ Targeting over 50% long - term when logistics and inflation issues pass and we execute growth plan ▪ GAAP net loss of $48M - $39M, or ($0.72) - ($0.59) per diluted share ▪ Non - GAAP net income $6M - $8M or $0.09 - $0.12 per diluted share ▪ Adjusted EBITDA of $34M - $37M Earnings Improvement ▪ $648M - $652M ‒ Removal of MakerBot ($17M) ‒ Delayed purchase activity ‒ Continuing FX challenges Revenue Growth Appx. 10% Y/Y* Operating Margins Improvement ▪ Non - GAAP slightly above 2% ▪ Targeting double - digit margins long - term CapEx Reduced ▪ $15M - $20M
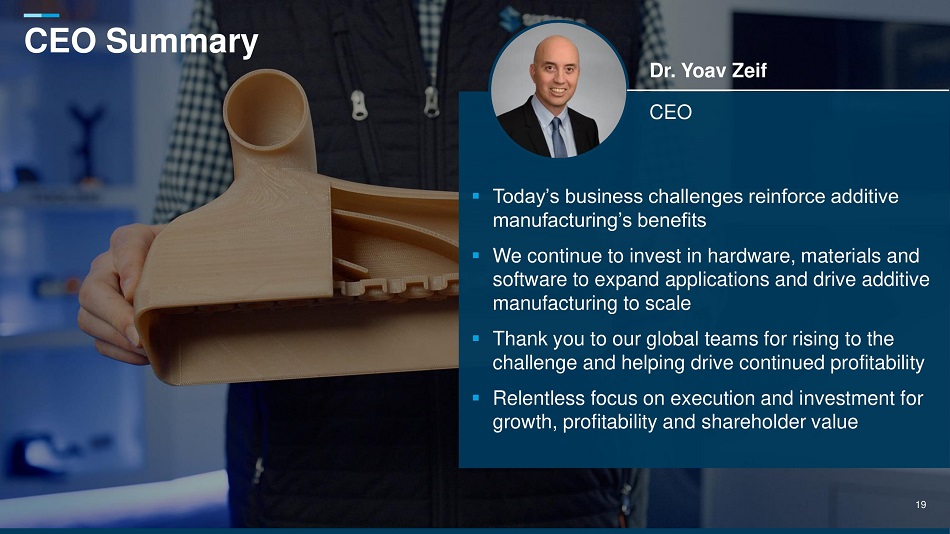
▪ Today’s business challenges reinforce additive manufacturing’s benefits ▪ We continue to invest in hardware, materials and software to expand applications and drive additive manufacturing to scale ▪ Thank you to our global teams for rising to the challenge and helping drive continued profitability ▪ Relentless focus on execution and investment for growth, profitability and shareholder value CEO Summary Dr. Yoav Zeif CEO 1 9 19 19
Thank You 20
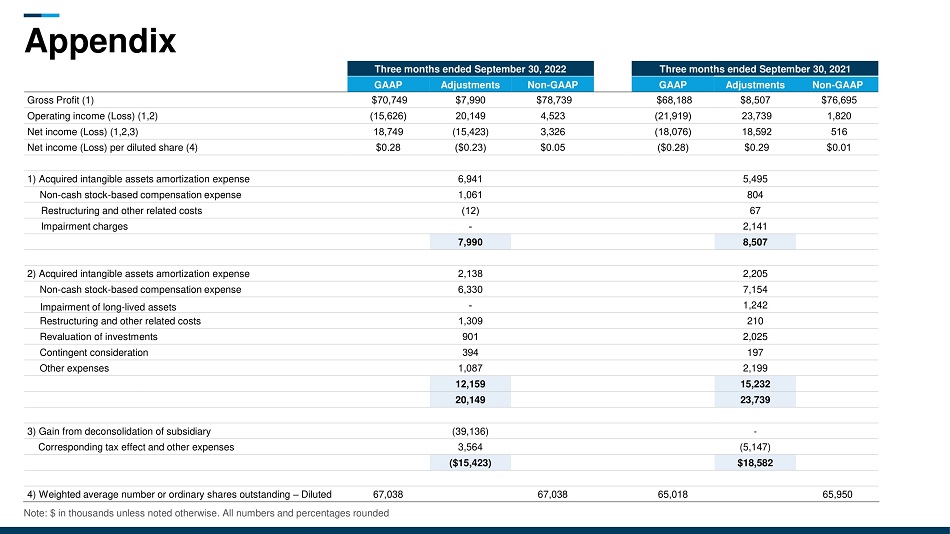
App e ndix Note: $ in thousands unless noted otherwise. All numbers and percentages rounded Three months ended September 30, 2022 Three months ended September 30, 2021 GAAP Adjustments Non - GAAP GAAP Adjustments Non - GAAP Gross Profit (1) $70,749 $7,990 $78,739 $68,188 $8,507 $76,695 Operating income (Loss) (1,2) (15,626) 20,149 4,523 (21,919) 23,739 1,820 Net income (Loss) (1,2,3) 18,749 (15,423) 3,326 (18,076) 18,592 516 Net income (Loss) per diluted share (4) $0.28 ($0.23) $0.05 ($0.28) $0.29 $0.01 1) Acquired intangible assets amortization expense 6,941 5,495 Non - cash stock - based compensation expense 1,061 804 Restructuring and other related costs (12) 67 Impairment charges - 2,141 7,990 8,507 2) Acquired intangible assets amortization expense 2,138 2,205 Non - cash stock - based compensation expense 6,330 7,154 Impairment of long - lived assets - 1,242 Restructuring and other related costs 1,309 210 Revaluation of investments 901 2,025 Contingent consideration 394 197 Other expenses 1,087 2,199 12,159 15,232 20,149 23,739 3) Gain from deconsolidation of subsidiary (39,136) - Corresponding tax effect and other expenses 3,564 (5,147) ($15,423) $18,582 4) Weighted average number or ordinary shares outstanding – Diluted 67,038 67,038 65,018 65,950