
Exhibit 99.2
Q2 2022 Results Speakers Dr. Yoav Zeif, CEO Eitan Zamir, CFO Yonah Lloyd, CCO & VP IR Aug. 3, 2022

Conference Call and Webcast Details US Toll - Free Dial - In 1 - 877 - 407 - 0629 International Dial - In 1 - 412 - 902 - 1012 Live Webcast and Replay https://event.choruscall.com/mediaframe/webcast.html? webcastid=mUfZ38Qo 2
Forward - Looking Statements Cautionary Statement Regarding Forward - Looking Statements The statements in this slide presentation regarding Stratasys' strategy, and the statements regarding its projected future financial performance, including the financial guidance concerning its expected results for 2022, are forward - looking statements reflecting management's current expectations and beliefs. These forward - looking statements are based on current information that is, by its nature, subject to rapid and even abrupt change. Due to risks and uncertainties associated with Stratasys' business, actual results could differ materially from those projected or implied by these forward - looking statements. These risks and uncertainties include, but are not limited to: the degree of our success at introducing new or improved products and solutions that gain market share; the extent of growth of the 3D printing market generally; the duration and severity of the macro - economic trends triggered by the global COVID - 19 pandemic, such as supply - chain delays, inflationary pressures and rising interest rates; the impact of potential shifts in the prices or margins of the products that we sell or services that we provide, including due to a shift towards lower margin products or services; the impact of competition and new technologies; the extent of our success at successfully integrating into our existing business, or making additional, acquisitions or investments in new businesses, technologies, products or services; potential changes in our management and board of directors; global market, political and economic conditions, and in the countries in which we operate in particular (including risks stemming from Russia’s invasion of Ukraine); potential further charges against earnings that we could be required to take due to impairment of additional goodwill or other intangible assets that we have recently acquired or may acquire in the future; costs and potential liability relating to litigation and regulatory proceedings; risks related to infringement of our intellectual property rights by others or infringement of others' intellectual property rights by us; the extent of our success at maintaining our liquidity and financing our operations and capital needs; the impact of tax regulations on our results of operations and financial condition; and those additional factors referred to in Item 3.D “Key Information - Risk Factors”, Item 4, “Information on the Company”, Item 5, “Operating and Financial Review and Prospects,” and all other parts of our Annual Report on Form 20 - F for the year ended December 31, 2021, filed with the SEC on February 24, 2022 (the “2021 Annual Report”). Readers are urged to carefully review and consider the various disclosures made throughout our 2021 Annual Report and the Reports of Foreign Private Issuer on Form 6 - K that attach Stratasys’ unaudited, condensed consolidated financial statements and its review of its results of operations and financial condition, for the quarterly periods throughout 2022, which will be furnished to the SEC over the course of 2022, and our other reports filed with or furnished to the SEC, which are designed to advise interested parties of the risks and factors that may affect our business, financial condition, results of operations and prospects. Any guidance provided, and other forward - looking statements made, in this slide presentation are made as of the date hereof, and Stratasys undertakes no obligation to publicly update or revise any forward - looking statements, whether as a result of new information, future events or otherwise, except as required by law. 3
Use of Non - GAAP Financial Information Use of Non - GAAP Financial Measures The non - GAAP data included herein, which excludes certain items as described below, are non - GAAP financial measures. Our management believes that these non - GAAP financial measures are useful information for investors and shareholders of our Company in gauging our results of operations (i) on an ongoing basis after excluding mergers, acquisitions and divestments related expense or gains and reorganization - related charges or gains, legal provisions, and (ii) excluding non - cash items such as stock - based compensation expenses, acquired intangible assets amortization, including intangible assets amortization related to equity method investments, impairment of long - lived assets and goodwill, revaluation of our investments and the corresponding tax effect of those items. These non - GAAP adjustments either do not reflect actual cash outlays that impact our liquidity and our financial condition or have a non - recurring impact on the statement of operations, as assessed by management. These non - GAAP financial measures are presented to permit investors to more fully understand how management assesses our performance for internal planning and forecasting purposes. The limitations of using these non - GAAP financial measures as performance measures are that they provide a view of our results of operations without including all items indicated above during a period, which may not provide a comparable view of our performance to other companies in our industry. Investors and other readers should consider non - GAAP measures only as supplements to, not as substitutes for or as superior measures to, the measures of financial performance prepared in accordance with GAAP. Reconciliation between results on a GAAP and non - GAAP basis is provided in a table later in this slide presentation. 4
▪ Q2 revenue of $166.6 million up 13.3% vs. Q2 2021 (16.4% after currency exchange impact) ▪ Systems revenue grew 29% vs. Q2 2021; All printer technologies grew YoY ▪ Balance sheet remains strong at $441.5M in cash and equivalents, with no debt ▪ Laser focus on business execution continues to help us deliver positive results as we grow our leadership position in polymer additive manufacturing Welcome Dr. Yoav Zeif CEO 5

Production Racing Parts Signal Automotive Opportunity First 3D printed production parts for NASCAR Next Gen Racecars using SAF and FDM technologies TRD partnership includes production parts using SAF and FDM technologies 6
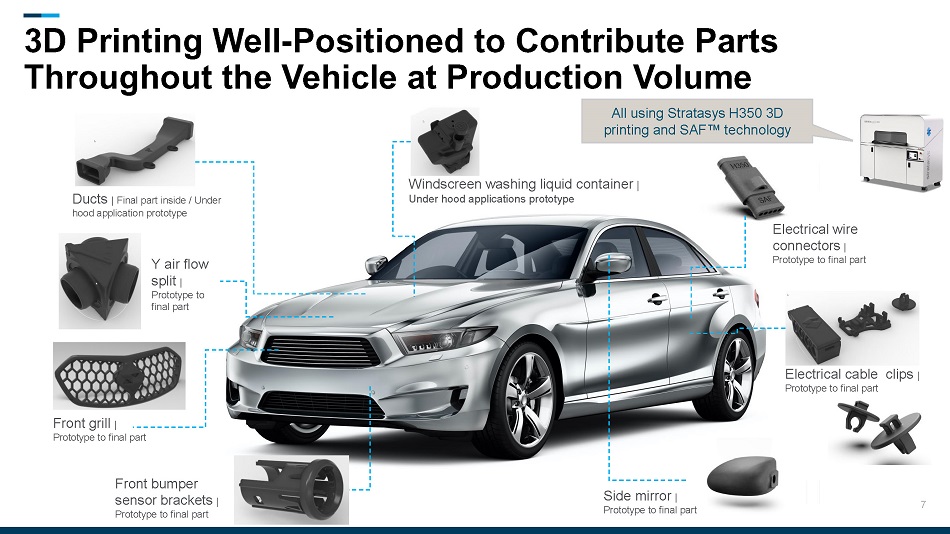
3D Printing Well - Positioned to Contribute Parts Throughout the Vehicle at Production Volume 7 Front bumper sensor brackets | Prototype to final part Ducts | Final part inside / Under hood application prototype Electrical wire connectors | Prototype to final part Front grill | Prototype to final part Windscreen washing liquid container | Under hood applications prototype Electrical cable clips | Prototype to final part Side mirror | Prototype to final part Y air flow split | Prototype to final part All using Stratasys H350 3D printing and SAF Πtechnology
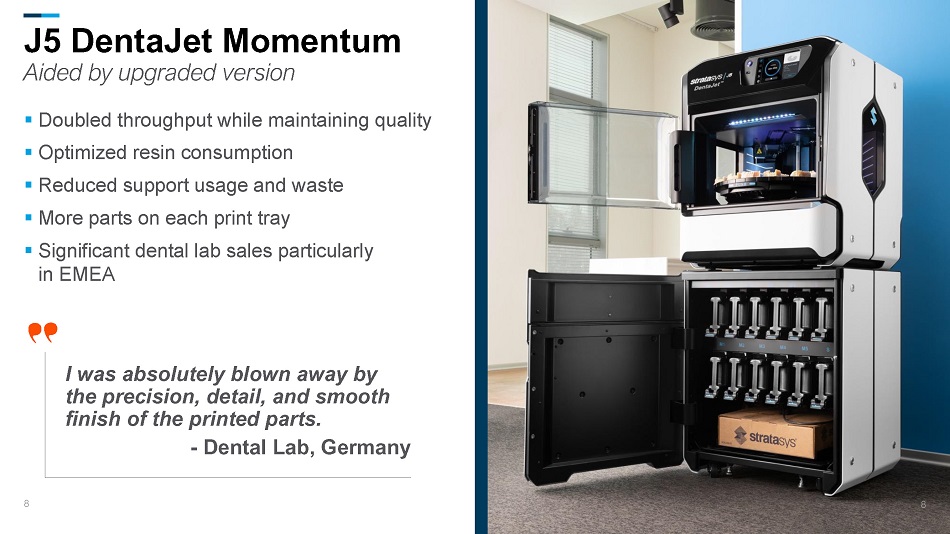
J5 DentaJet Momentum Aided by upgraded version ▪ Doubled throughput while maintaining quality ▪ Optimized resin consumption ▪ Reduced support usage and waste ▪ More parts on each print tray ▪ Significant dental lab sales particularly in EMEA I was absolutely blown away by the precision, detail, and smooth finish of the printed parts. - Dental Lab, Germany 8 8
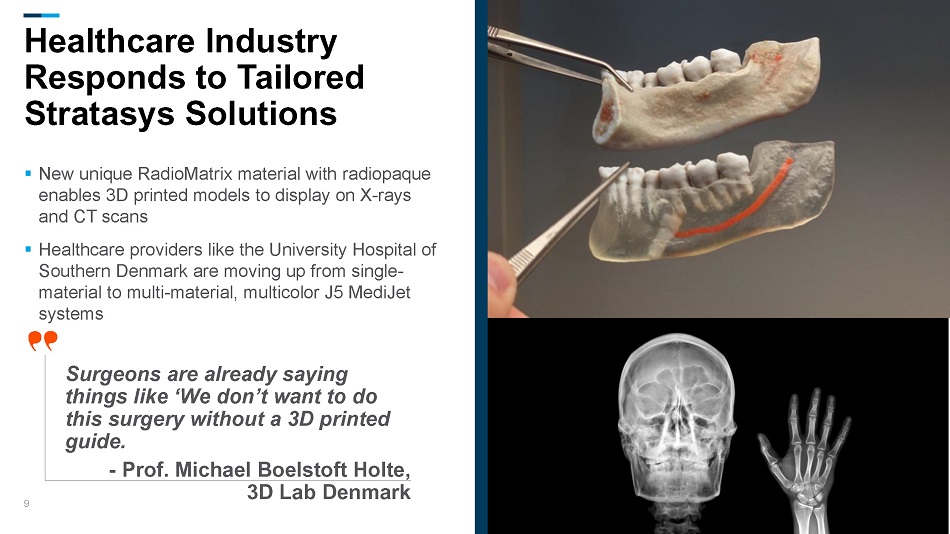
Healthcare Industry Responds to Tailored Stratasys Solutions ▪ New unique RadioMatrix material with radiopaque enables 3D printed models to display on X - rays and CT scans ▪ Healthcare providers like the University Hospital of Southern Denmark are moving up from single - material to multi - material, multicolor J5 MediJet systems Surgeons are already saying things like ‘We don’t want to do this surgery without a 3D printed guide. - Prof. Michael Boelstoft Holte, 3D Lab Denmark 9
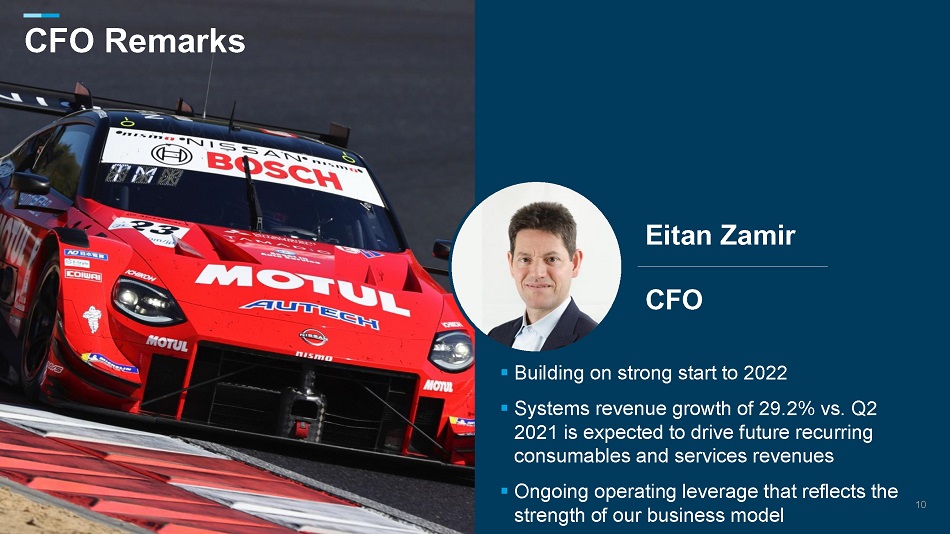
CFO Remarks 10 Eitan Zamir CFO ▪ Building on strong start to 2022 ▪ Systems revenue growth of 29 . 2 % vs . Q 2 2021 is expected to drive future recurring consumables and services revenues ▪ Ongoing operating leverage that reflects the strength of our business model
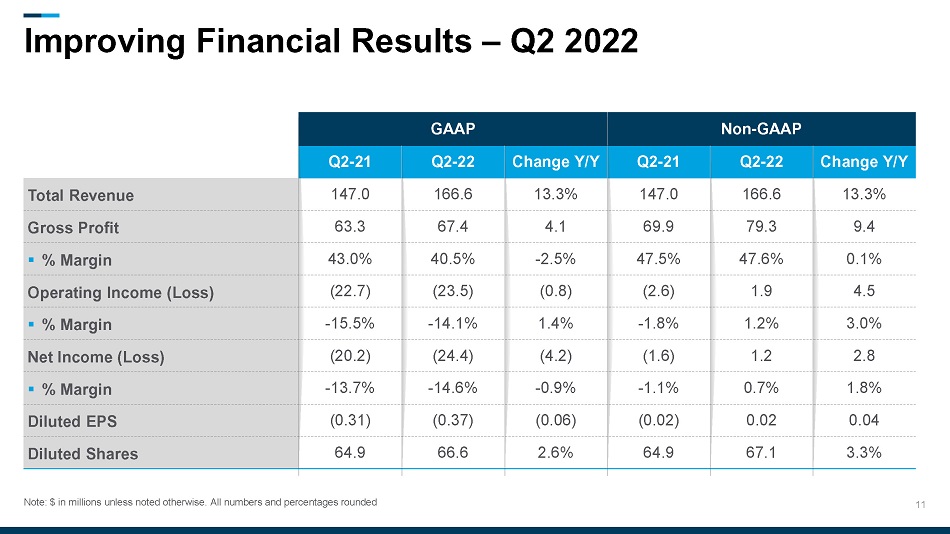
Improving Financial Results – Q2 2022 GAAP Non - GAAP Q2 - 21 Q2 - 22 Change Y/Y Q2 - 21 Q2 - 22 Change Y/Y Total Revenue 147.0 166.6 13.3% 147.0 166.6 13.3% Gross Profit 63.3 67.4 4.1 69.9 79.3 9.4 ▪ % Margin 43.0% 40.5% - 2.5% 47.5% 47.6% 0.1% Operating Income (Loss) (22.7) (23.5) (0.8) (2.6) 1.9 4.5 ▪ % Margin - 15.5% - 14.1% 1.4% - 1.8% 1.2% 3.0% Net Income (Loss) (20.2) (24.4) (4.2) (1.6) 1.2 2.8 ▪ % Margin - 13.7% - 14.6% - 0.9% - 1.1% 0.7% 1.8% Diluted EPS (0.31) (0.37) (0.06) (0.02) 0.02 0.04 Diluted Shares 64.9 66.6 2.6% 64.9 67.1 3.3% Note: $ in millions unless noted otherwise. All numbers and percentages rounded 11
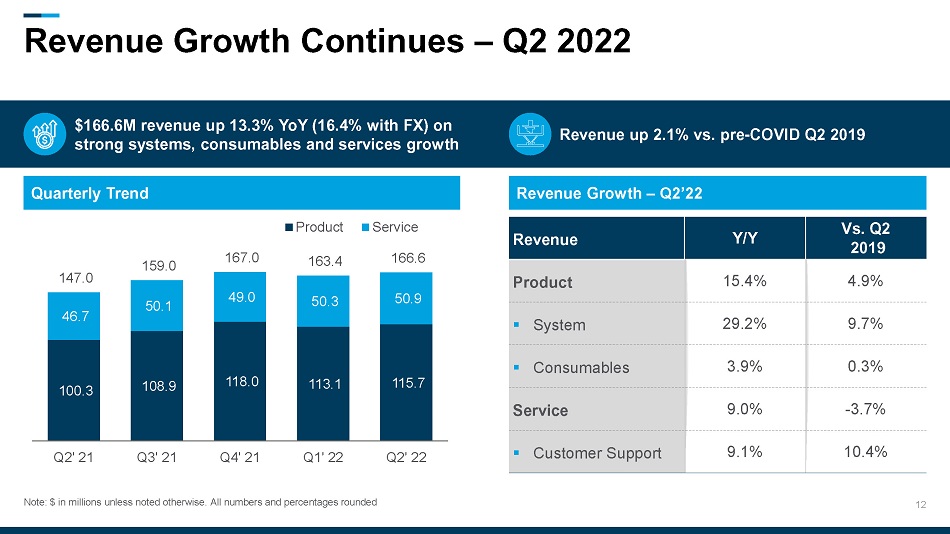
Revenue Growth Continues – Q2 2022 Quarterly Trend Revenue Growth – Q2’22 100.3 108.9 118.0 113.1 115.7 46.7 50.1 49.0 50.3 50.9 147.0 159.0 167.0 163.4 166.6 Q2' 21 Q3' 21 Q4' 21 Q1' 22 Q2' 22 Product Service Revenue Y/Y Vs. Q2 2019 Product 15.4% 4.9% ▪ System 29.2% 9.7% ▪ Consumables 3.9% 0.3% Service 9.0% - 3.7% ▪ Customer Support 9.1% 10.4% $166.6M revenue up 13.3% YoY (16.4% with FX) on strong systems, consumables and services growth Revenue up 2.1% vs. pre - COVID Q2 2019 Note: $ in millions unless noted otherwise. All numbers and percentages rounded 12
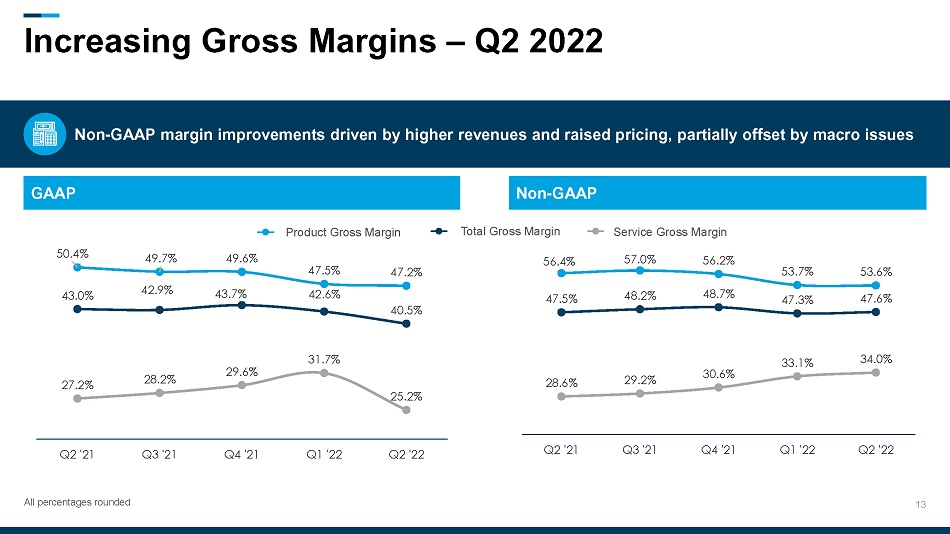
Increasing Gross Margins – Q2 2022 13 GAAP Non - GAAP Non - GAAP margin improvements driven by higher revenues and raised pricing, partially offset by macro issues 43.0% 42.9% 43.7% 40.5% 50.4% 49.7% 49.6% 47.5% 42.6% 47.2% 27.2% 28.2% 29.6% 31.7% 25.2% Q2 '21 Q3 '21 Q4 '21 Q1 '22 Q2 '22 47.5% 48.2% 48.7% 47.3% 47.6% 56.4% 57.0% 56.2% 53.7% 53.6% 28.6% 29.2% 30.6% 33.1% 34.0% Q2 '21 Q3 '21 Q4 '21 Q1 '22 Q2 '22 Total Gross Margin Service Gross Margin Product Gross Margin All percentages rounded
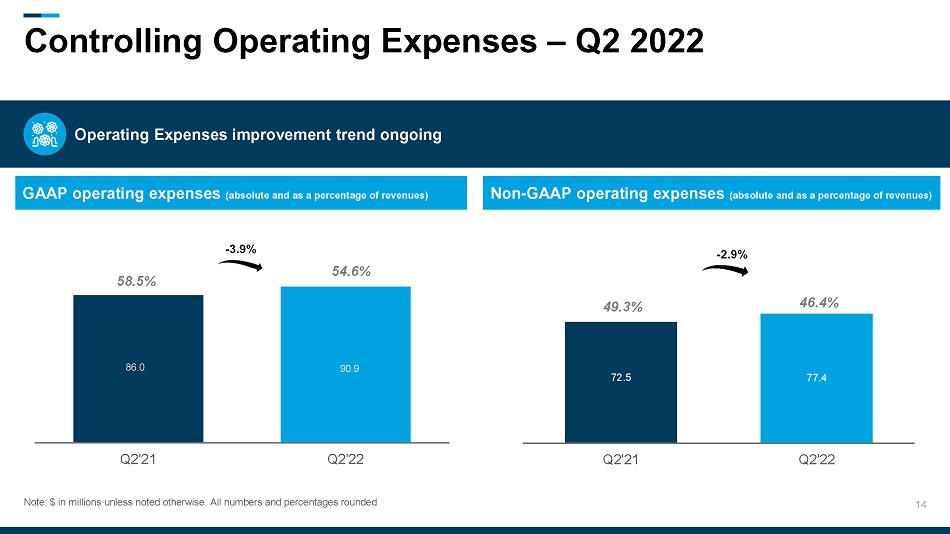
Controlling Operating Expenses – Q2 2022 GAAP operating expenses (absolute and as a percentage of revenues) Non - GAAP operating expenses (absolute and as a percentage of revenues) Operating Expenses improvement trend ongoing 86.0 90.9 Q2'21 Q2'22 54.6% - 3.9% 58.5% 72.5 77.4 Q2'21 Q2'22 46.4% - 2.9% 49.3% Note: $ in millions unless noted otherwise. All numbers and percentages rounded 14
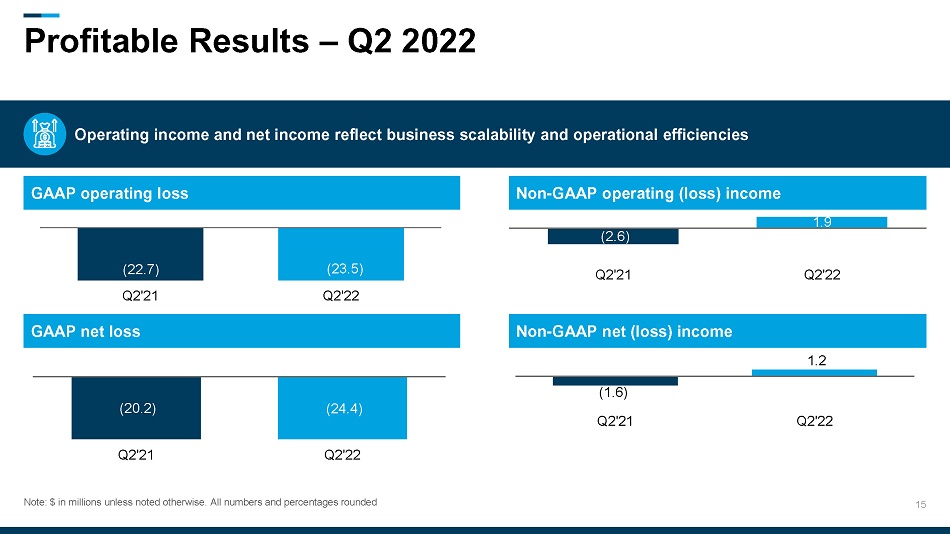
Profitable Results – Q2 2022 GAAP operating loss Non - GAAP operating (loss) income Operating income and net income reflect business scalability and operational efficiencies GAAP net loss Non - GAAP net (loss) income (22.7) (23.5) Q2'21 Q2'22 (2.6) 1.9 Q2'21 Q2'22 (20.2) (24.4) Q2'21 Q2'22 (1.6) 1.2 Q2'21 Q2'22 Note: $ in millions unless noted otherwise. All numbers and percentages rounded 15
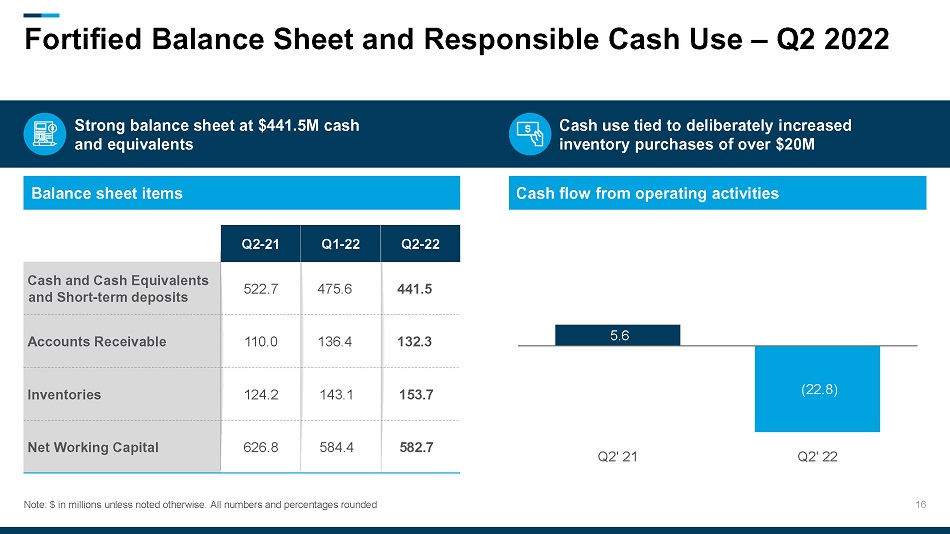
Fortified Balance Sheet and Responsible Cash Use – Q2 2022 Strong balance sheet at $441.5M cash and equivalents Cash use tied to deliberately increased inventory purchases of over $20M Balance sheet items Cash flow from operating activities 5.6 (22.8) Q2' 21 Q2' 22 Q2 - 21 Q1 - 22 Q2 - 22 Cash and Cash Equivalents and Short - term deposits 522.7 475.6 441.5 Accounts Receivable 110.0 136.4 132.3 Inventories 124.2 143.1 153.7 Net Working Capital 626.8 584.4 582.7 Note: $ in millions unless noted otherwise. All numbers and percentages rounded 16
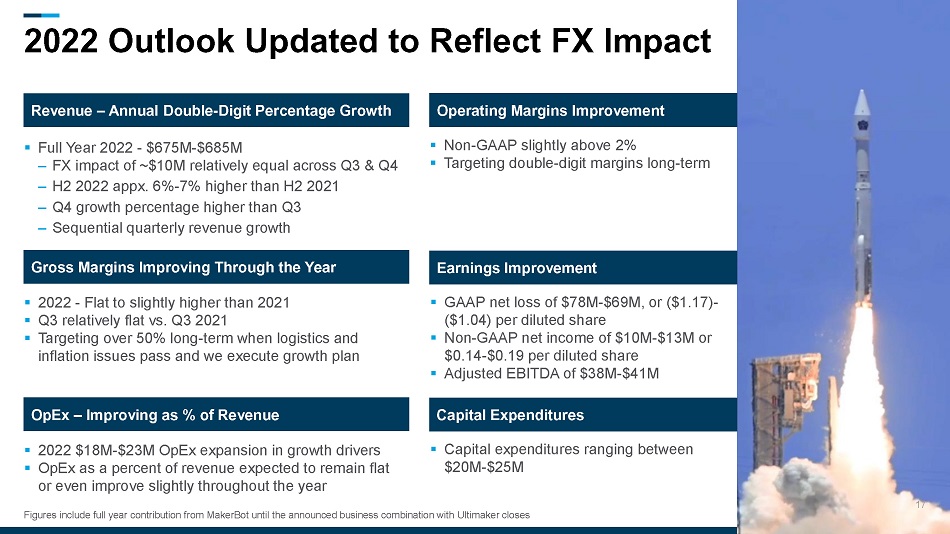
2022 Outlook Updated to Reflect FX Impact 17 Figures include full year contribution from MakerBot until the announced business combination with Ultimaker closes ▪ Full Year 2022 - $675M - $685M ‒ FX impact of ~$10M relatively equal across Q3 & Q4 ‒ H2 2022 appx. 6% - 7% higher than H2 2021 ‒ Q4 growth percentage higher than Q3 ‒ Sequential quarterly revenue growth Revenue – Annual Double - Digit Percentage Growth ▪ 2022 $18M - $23M OpEx expansion in growth drivers ▪ OpEx as a percent of revenue expected to remain flat or even improve slightly throughout the year Gross Margins Improving Through the Year ▪ 2022 - Flat to slightly higher than 2021 ▪ Q3 relatively flat vs. Q3 2021 ▪ Targeting over 50% long - term when logistics and inflation issues pass and we execute growth plan OpEx – Improving as % of Revenue ▪ GAAP net loss of $78M - $69M, or ($1.17) - ($1.04) per diluted share ▪ Non - GAAP net income of $10M - $13M or $0.14 - $0.19 per diluted share ▪ Adjusted EBITDA of $38M - $41M Earnings Improvement Operating Margins Improvement ▪ Non - GAAP slightly above 2% ▪ Targeting double - digit margins long - term ▪ Capital expenditures ranging between $20M - $25M Capital Expenditures
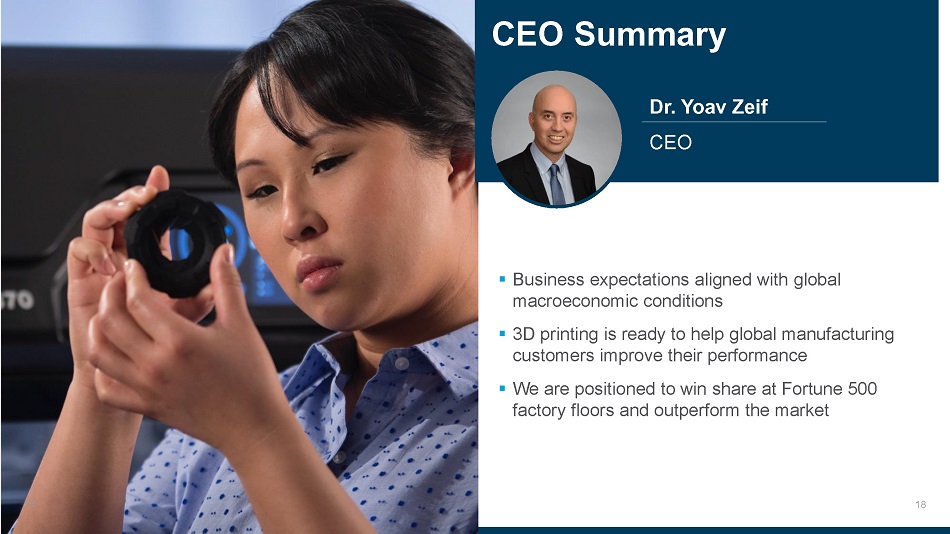
CEO Summary Dr. Yoav Zeif CEO ▪ Business expectations aligned with global macroeconomic conditions ▪ 3D printing is ready to help global manufacturing customers improve their performance ▪ We are positioned to win share at Fortune 500 factory floors and outperform the market 18 18

Thank Y ou 19
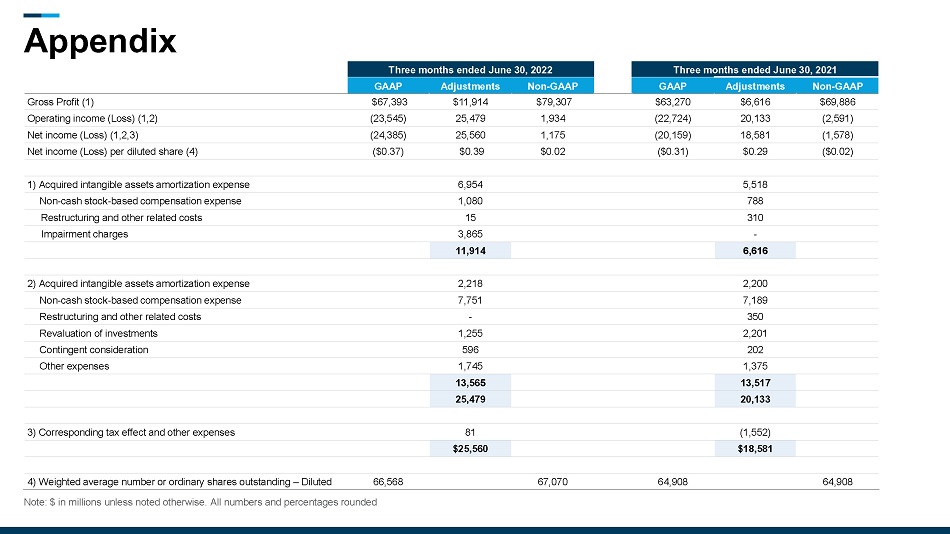
Appendix Note: $ in millions unless noted otherwise. All numbers and percentages rounded Three months ended June 30, 2022 Three months ended June 30, 2021 GAAP Adjustments Non - GAAP GAAP Adjustments Non - GAAP Gross Profit (1) $67,393 $11,914 $79,307 $63,270 $6,616 $69,886 Operating income (Loss) (1,2) (23,545) 25,479 1,934 (22,724) 20,133 (2,591) Net income (Loss) (1,2,3) (24,385) 25,560 1,175 (20,159) 18,581 (1,578) Net income (Loss) per diluted share (4) ($0.37) $0.39 $0.02 ($0.31) $0.29 ($0.02) 1) Acquired intangible assets amortization expense 6,954 5,518 Non - cash stock - based compensation expense 1,080 788 Restructuring and other related costs 15 310 Impairment charges 3,865 - 11,914 6,616 2) Acquired intangible assets amortization expense 2,218 2,200 Non - cash stock - based compensation expense 7,751 7,189 Restructuring and other related costs - 350 Revaluation of investments 1,255 2,201 Contingent consideration 596 202 Other expenses 1,745 1,375 13,565 13,517 25,479 20,133 3) Corresponding tax effect and other expenses 81 (1,552) $25,560 $18,581 4) Weighted average number or ordinary shares outstanding – Diluted 66,568 67,070 64,908 64,908