Exhibit 99.2
Second Quarter 2021 Results August 5th, 2021 Speakers Dr. Yoav Zeif – CEO Lilach Payorski – CFO Yonah Lloyd – CCO / VP Investor Relations
US Toll - Free dial - in: 1 - 877 - 407 - 0619 International dial - in +1 - 412 - 902 - 1012 Live webcast and replay: https://78449.themediaframe.com/dataconf/productusers/ssys/mediaframe/44880/indexl.html Conference Call & Webcast Details

Forward - Looking Statements 3 Cautionary Statement Regarding Forward - Looking Statements The statements in this press release regarding Stratasys ' strategy, and the statements regarding its projected future financial performance, including the financial guidance concerning its expected results for 2021, are forward - looking statements reflecting management's current expectations and beliefs. These forward - looking statements are based on current information that is, by its nature, subject to rapid and even abrupt change. Due to risks and uncertainties associated with Stratasys ' business, actual results could differ materially from those projected or implied by these forward - looking statements. These risks and uncertainties include, but are not limited to: the degree of our success at introducing new or improved products and solutions that gain market share; the degree of growth of the 3D printing market generally; the duration and degree of severity of, and strength of recovery from, the global COVID - 19 pandemic; the impact of potential shifts in the prices or margins of the products that we sell or services that we provide, including due to a shift towards lo wer margin products or services; the impact of competition and new technologies; the extent of our success at successfully integrating into our existing business, or making additional, acquisitions or investments in new businesses, technologies, products or services; potential changes in our management and board of directors; global market, political and economic conditions, and in the countries in which we operate in particular (including risks related to the impact of coronavirus on o ur supply chain and business); potential further charges against earnings that we could be required to take due to impairment of additional goodwill or other intangible assets that we have recently acquired or may acquire in the future; costs and potential liability relating to litigation and regulatory proceedings; risks related to infringement of our intellectual prop ert y rights by others or infringement of others' intellectual property rights by us; the extent of our success at maintaining our liquidity and financing our operations and capital needs; the impact of tax regulations on our results of operations and financial condition; and those additional factors referred to in Item 3.D “Key Information - Risk Factors”, Item 4, “Information on the Company”, Item 5, “Operating and Financial Review and Prospects,” and all other parts of our Annual Report on Form 20 - F for the year ended December 31, 2020 (the “ 2020 Annual Report ”). Readers are urged to carefully review and consider the various disclosures made throughout our 2020 Annual Report and the Reports of Foreign Private Issuer on Form 6 - K that attach Stratasys ’ unaudited, condensed consolidated financial statements and its review of its results of operations and financial condition, for the quarterly periods throughout 2021, which are furnished to the SEC over the course of 2021 (including on or about the date hereof), and our other reports filed with or furnished to the SEC, which are designed to advise interested parties of the risks and factors that may affect our business, financial condition, results of operation s a nd prospects. Any guidance provided, and other forward - looking statements made, in this slide presentation are made as of the date hereof, and Stratasys undertakes no obligation to publicly update or revise any forward - looking statements, whether as a result of new information, future events or otherwise, except as required by law.
Use of Non - GAAP Financial Information 4 Use of non - GAAP financial measures The non - GAAP data included herein, which excludes certain items as described below, are non - GAAP financial measures. Our management believes that these non - GAAP financial measures are useful information for investors and shareholders of our Company in gauging our results of operations ( i ) on an ongoing basis after excluding mergers, acquisitions and divestments related expense or gains and reorganization - related charges or gains, and (ii) excluding non - cash items such as stock - based compensation expenses, acquired intangible assets amortization, including intangible assets amortization related to equity method investments, impairment of long - lived assets and goodwill, revaluation of our investments and the corresponding tax effect of those items. These non - GAAP adjustments either do not reflect actual cash outlays that impact our liquidity and our financial condition or have a non - recurring impact on the statement of operations, as assessed by management. These non - GAAP financial measures are presented to permit investors to more fully understand how management assesses our performance for internal planning and forecasting purposes. The limitations of using these non - GAAP financial measures as performance measures are that they provide a view of our results of operations without including all items indicated above during a period, which may not provide a comparable view of our performance to other companies in our industry. Investors and other readers should consider non - GAAP measures only as supplements to, not as substitutes for or as superior measures to, the measures of financial performance prepared in accordance with GAAP. Reconciliation between results on a GAAP and non - GAAP basis is provided in a table later in this slide presentation.
CEO Opening Remarks 5 Our growth is accelerating as the industry shifts from prototyping to mass production and Stratasys offers the most innovative technologies for the fastest - growing manufacturing applications. 25% year - over - year revenue growth, highlighted by 32% HW and 39% Consumables growth. Third consecutive quarter of sustained revenue growth. Broad strength across regions and business lines as recovery from the pandemic continues. Dr. Yoav Zeif CEO
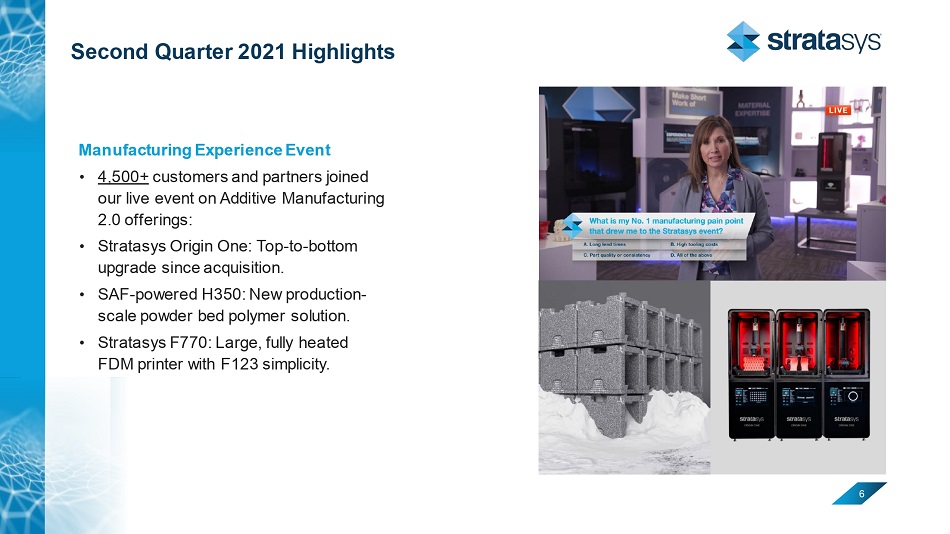
Second Quarter 2021 Highlights 6 6 Manufacturing Experience Event • 4,500+ customers and partners joined our live event on Additive Manufacturing 2.0 offerings: • Stratasys Origin One: Top - to - bottom upgrade since acquisition. • SAF - powered H350: New production - scale powder bed polymer solution. • Stratasys F770: Large, fully heated FDM printer with F123 simplicity .
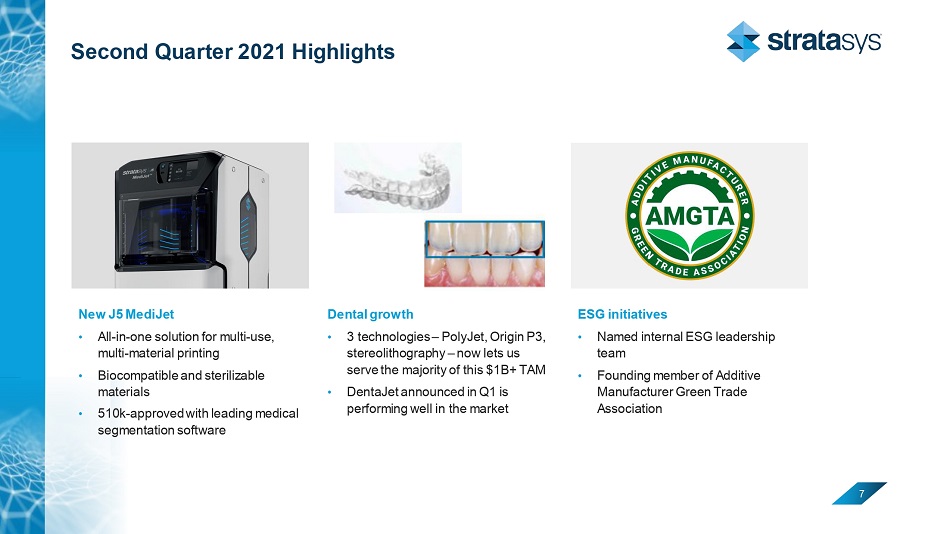
Second Quarter 2021 Highlights 7 7 New J5 MediJet • All - in - one solution for multi - use, multi - material printing • Biocompatible and sterilizable materials • 510k - approved with leading medical segmentation software Dental growth • 3 technologies – PolyJet , Origin P3, stereolithography – now lets us serve the majority of this $1B+ TAM • DentaJet announced in Q1 is performing well in the market ESG initiatives • Named internal ESG leadership team • Founding member of Additive Manufacturer Green Trade Association
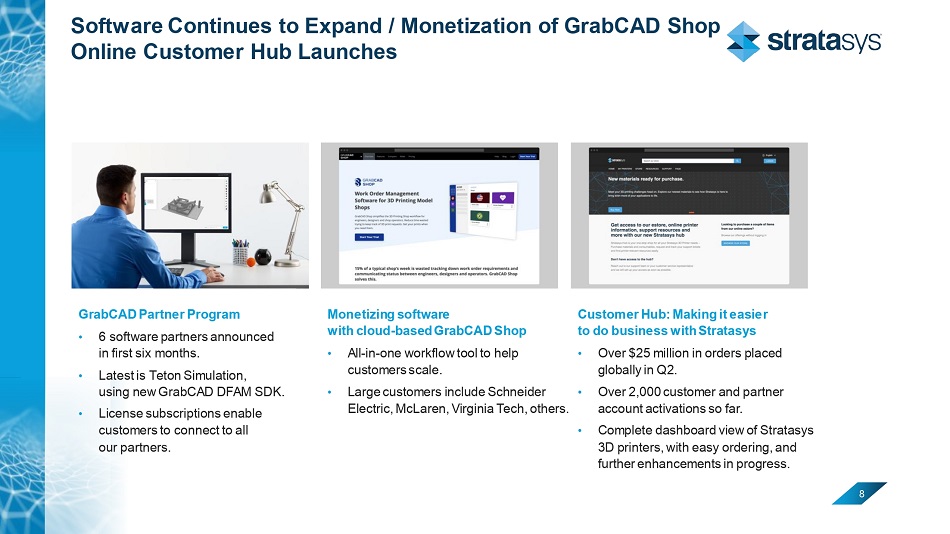
Software Continues to Expand / Monetization of GrabCAD Shop Online Customer Hub Launches 8 8 GrabCAD Partner Program • 6 software partners announced in first six months. • Latest is Teton Simulation, using new GrabCAD DFAM SDK. • License subscriptions enable customers to connect to all our partners. Monetizing software with cloud - based GrabCAD Shop • All - in - one workflow tool to help customers scale. • Large customers include Schneider Electric, McLaren, Virginia Tech, others. Customer Hub: Making it easier to do business with Stratasys • Over $25 million in orders placed globally in Q2. • Over 2,000 customer and partner account activations so far. • Complete dashboard view of Stratasys 3D printers, with easy ordering, and further enhancements in progress.
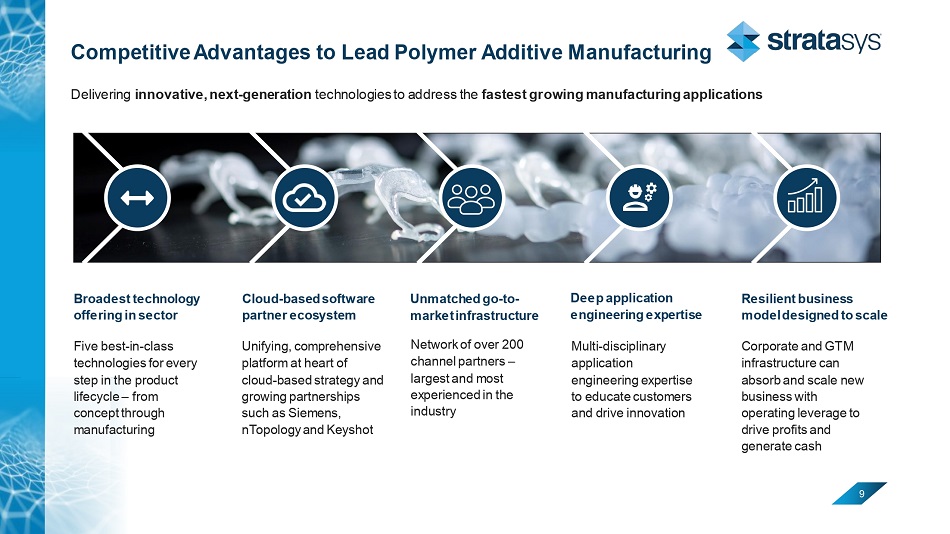
Competitive Advantages to Lead Polymer Additive Manufacturing 9 Broadest technology offering in sector Deep application engineering expertise Unmatched go - to - market infrastructure Resilient business model designed to scale Cloud - based software partner ecosystem Five best - in - class technologies for every step in the product lifecycle – from concept through manufacturing Network of over 200 channel partners – largest and most experienced in the industry Multi - disciplinary application engineering expertise to educate customers and drive innovation Corporate and GTM infrastructure can absorb and scale new business with operating leverage to drive profits and generate cash Unifying, comprehensive platform at heart of cloud - based strategy and growing partnerships such as Siemens, nTopology and Keyshot Delivering innovative, next - generation technologies to address the fastest growing manufacturing applications
Financial Highlights Lilach Payorski CFO 25% growth exceeded revenue outlook Produced 32% growth in systems and 39% in consumables year over year Generated $5.6m in OCF Updated outlook 10
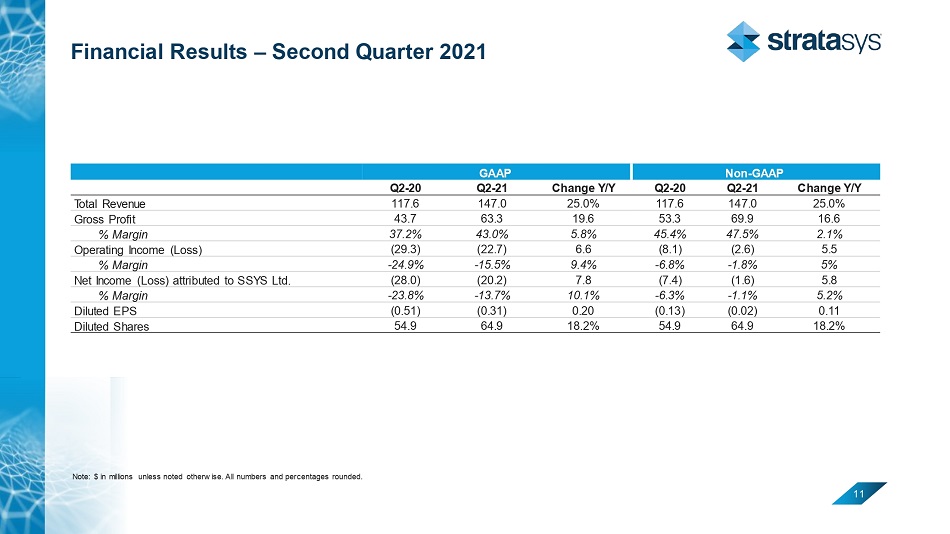
Financial Results – Second Quarter 2021 11 GAAP Non - GAAP Q 2 - 20 Q 2 - 21 Change Y/Y Q 2 - 20 Q 2 - 21 Change Y/Y Total Revenue 117 . 6 147 . 0 25 .0% 1 17 . 6 1 47 . 0 25 .0% Gross Profit 43.7 63.3 19.6 53 .3 6 9 . 9 16.6 % Margin 37 . 2 % 4 3 . 0 % 5.8 % 4 5 .4% 4 7 . 5 % 2.1 % Operating Income (Loss) ( 2 9. 3 ) ( 22 . 7 ) 6.6 (8. 1 ) (2.6) 5. 5 % Margin - 24 . 9 % - 1 5 . 5 % 9.4 % - 6. 8 % - 1. 8 % 5 % Net Income (Loss) attributed to SSYS Ltd. ( 28 . 0 ) ( 20 . 2 ) 7 .8 ( 7 . 4 ) ( 1 . 6 ) 5 .8 % Margin - 23 . 8 % - 1 3 . 7 % 10 . 1 % - 6 . 3 % - 1 . 1 % 5. 2 % Diluted EPS (0. 51 ) (0.3 1 ) 0. 20 (0.1 3 ) (0.0 2 ) 0.1 1 Diluted Shares 54. 9 64.9 18 . 2 % 54. 9 64 . 9 18 . 2 % Note: $ in millions unless noted otherwise. All numbers and percentages rounded.
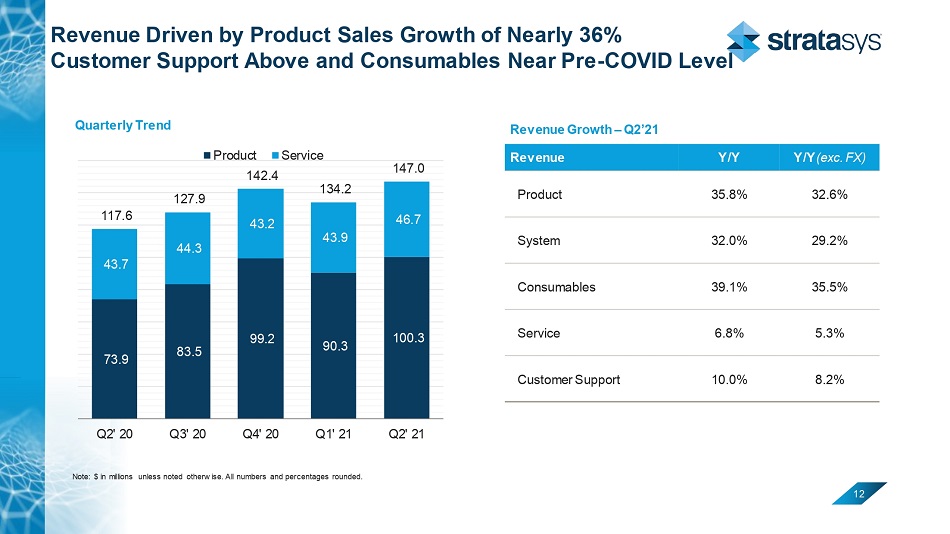
12 Note: $ in millions unless noted otherwise. All numbers and percentages rounded. Quarterly Trend 73.9 83.5 99.2 90.3 100.3 43.7 44.3 43.2 43.9 46.7 117.6 127.9 142.4 134.2 147.0 Q2' 20 Q3' 20 Q4' 20 Q1' 21 Q2' 21 Product Service Revenue Growth – Q2’21 Revenue Y/Y Y/Y (exc. FX) Product 35.8% 32.6% System 32.0% 29.2% Consumables 39.1% 35.5% Service 6.8% 5.3% Customer Support 10.0% 8.2% Revenue Driven by Product Sales Growth of Nearly 36% Customer Support Above and Consumables Near Pre - COVID Level
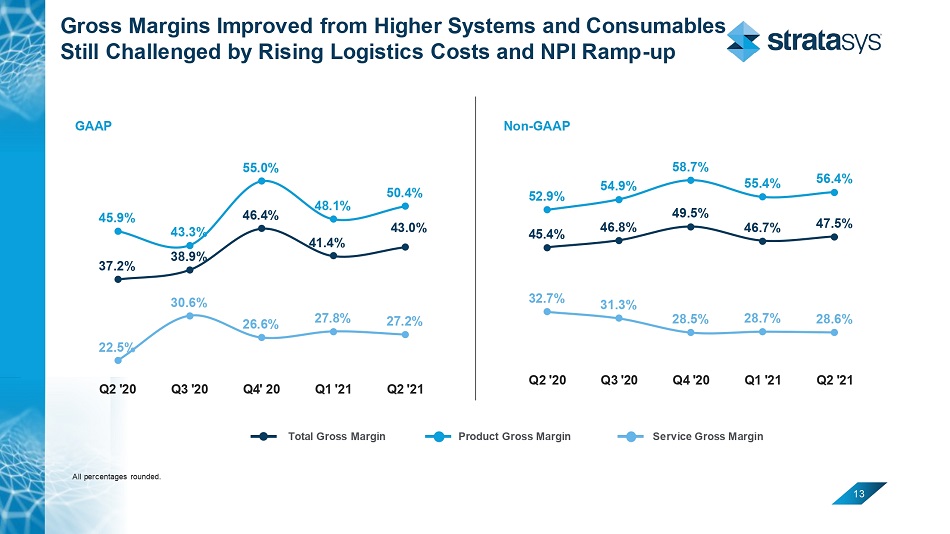
Gross Margins Improved from Higher Systems and Consumables Still Challenged by Rising Logistics Costs and NPI Ramp - up 13 All percentages rounded. GAAP Non - GAAP 37.2% 38.9% 46.4% 41.4% 43.0% 45.9% 43.3% 55.0% 48.1% 50.4% 22.5% 30.6% 26.6% 27.8% 27.2% Q2 '20 Q3 '20 Q4' 20 Q1 '21 Q2 '21 45.4% 46.8% 49.5% 46.7% 47.5% 52.9% 54.9% 58.7% 55.4% 56.4% 32.7% 31.3% 28.5% 28.7% 28.6% Q2 '20 Q3 '20 Q4 '20 Q1 '21 Q2 '21 Total Gross Margin Product Gross Margin Service Gross Margin
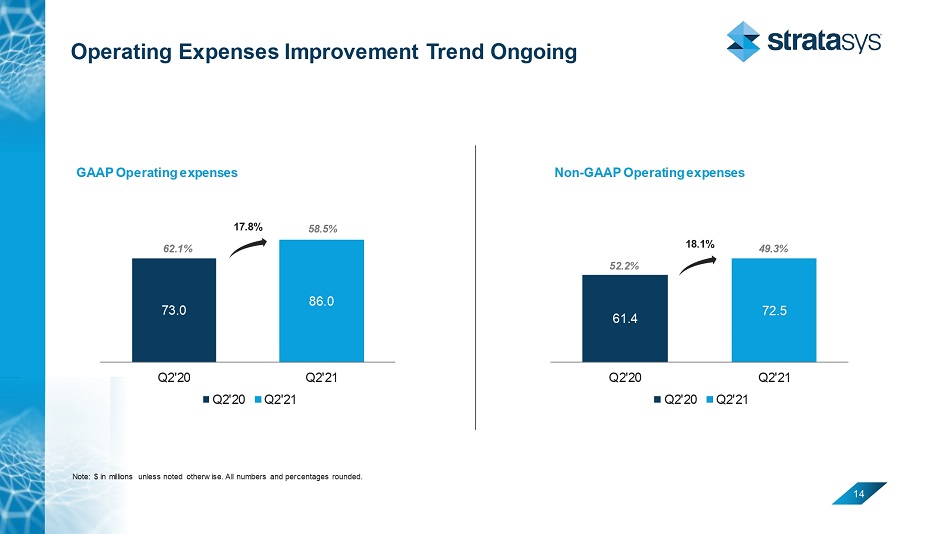
Operating Expenses Improvement Trend Ongoing 14 73.0 86.0 Q2'20 Q2'21 Q2'20 Q2'21 17.8% 61.4 72.5 Q2'20 Q2'21 Q2'20 Q2'21 Non - GAAP Operating expenses . % GAAP Operating expenses Note: $ in millions unless noted otherwise. All numbers and percentages rounded. 58.5% 62.1% 52.2% 49.3%
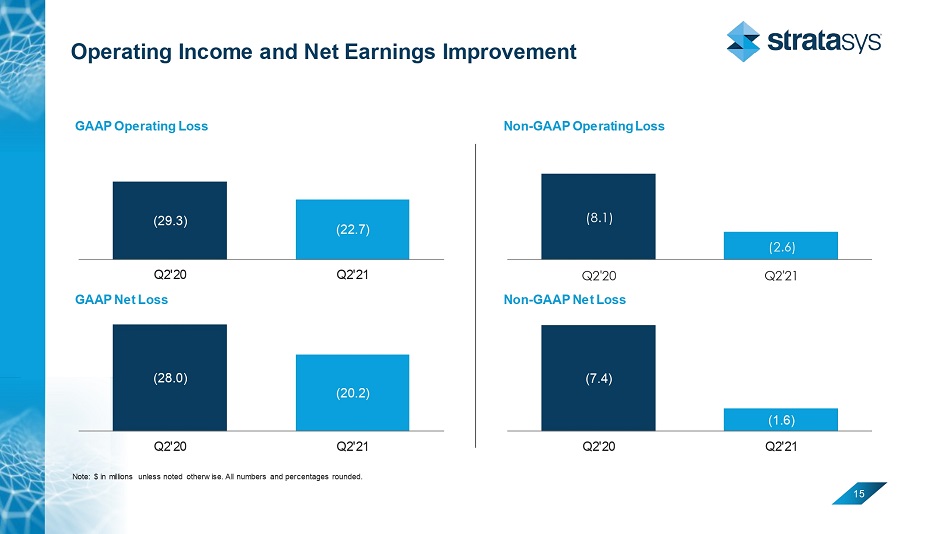
Operating Income and Net Earnings Improvement 15 GAAP Operating Loss Non - GAAP Operating Loss (29.3) (22.7) Q2'20 Q2'21 (8.1) (2.6) Q2'20 Q2'21 GAAP Net Loss Non - GAAP Net Loss (28.0) (20.2) Q2'20 Q2'21 (7.4) (1.6) Q2'20 Q2'21 Note: $ in millions unless noted otherwise. All numbers and percentages rounded.
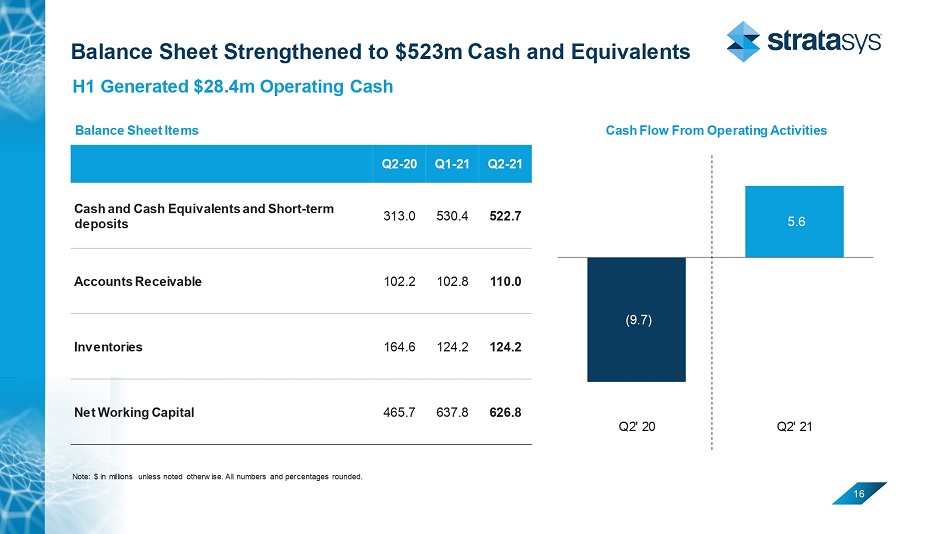
Balance Sheet Strengthened to $523m Cash and Equivalents 16 Balance Sheet Items Cash Flow From Operating Activities (9.7) 5.6 Q2' 20 Q2' 21 Q2 - 20 Q1 - 21 Q2 - 21 Cash and Cash Equivalents and Short - term deposits 313.0 530.4 522.7 Accounts Receivable 102.2 102.8 110.0 Inventories 164.6 124.2 124.2 Net Working Capital 465.7 637.8 626.8 Note: $ in millions unless noted otherwise. All numbers and percentages rounded. H 1 Generated $ 2 . m Operating Cash
2021 Outlook 17 Revenue in the third quarter 2021 is expected to grow 17% - 18% compared to third quarter 2020. Fourth quarter revenue is expected to be sequentially higher. Operating expenses for 2021 are expected to be approximately $30M higher than 2020, reflecting the return to full - time work and operating costs associated with the gradual recovery of our end markets. Capital expenditures in 2021 expected to range from $24M to $30M. We are committed to growing our leadership position as the 3D printing industry shifts from prototyping to mass production.
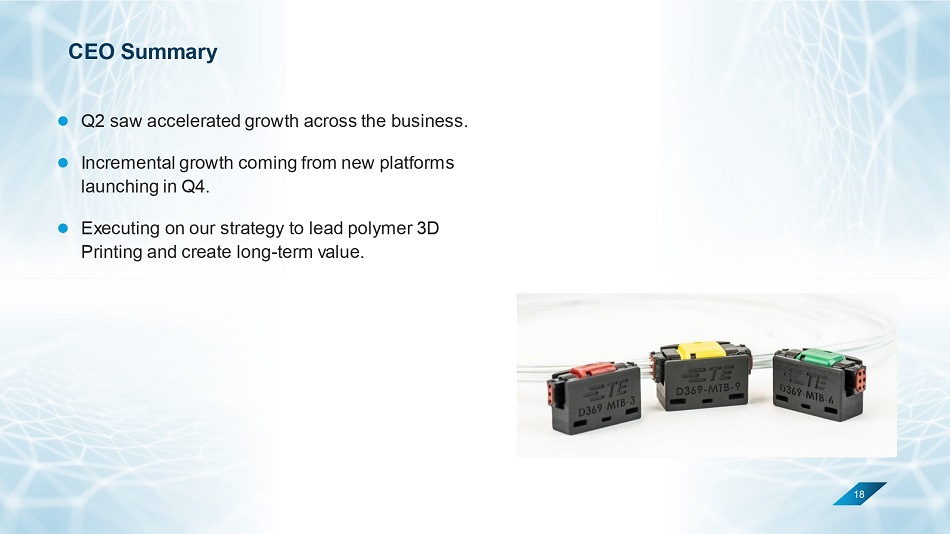
18 CEO Summary Q2 saw accelerated growth across the business. Incremental growth coming from new platforms launching in Q4. Executing on our strategy to lead polymer 3D Printing and create long - term value.
Thank You: Q&A 19
Appendix 20
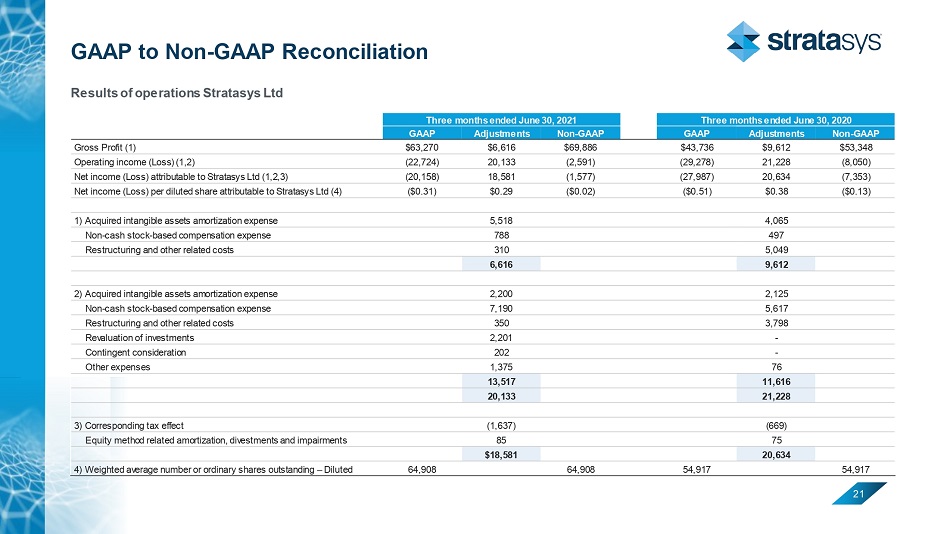
GAAP to Non - GAAP Reconciliation 21 Results of operations Stratasys Ltd Three months ended June 30, 2021 Three months ended June 30 , 2020 GAAP Adjustments Non - GAAP GAAP Adjustments Non - GAAP Gross Profit (1) $63,270 $6,616 $69,886 $ 43,736 $9,612 $53,348 Operating income (Loss) (1,2) (22,724) 20,133 (2,591) (29,278) 21,228 (8,050) Net income (Loss) attributable to Stratasys Ltd (1,2,3) (20,158) 18,581 (1,577) (27,987) 20,634 (7,353) Net income (Loss) per diluted share attributable to Stratasys Ltd (4) ($0.31) $0.29 ($0.02) ($0.51) $0.38 ($0.13) 1) Acquired intangible assets amortization expense 5,518 4,065 Non - cash stock - based compensation expense 788 497 Restructuring and other related costs 310 5,049 6,616 9,612 2) Acquired intangible assets amortization expense 2,200 2,125 Non - cash stock - based compensation expense 7,190 5,617 Restructuring and other related costs 350 3,798 Revaluation of investments 2,201 - Contingent consideration 202 - Other expenses 1,375 76 13,517 11,616 20,133 21,228 3) Corresponding tax effect (1,637) (669) Equity method related amortization, divestments and impairments 85 75 $18,581 20,634 4) Weighted average number or ordinary shares outstanding – Diluted 64,908 64,908 54,917 54,917