
Exhibit 99.2
Q4 and FY 2020 | Conference call & webcast details February 2021 Speakers Yoav Zeif – CEO Lilach Payorski – CFO Yonah Lloyd – VP Investor Relations Live dial - in information US Toll - Free dial - in: 1 - 877 - 407 - 0619 International dial - in: +1 - 412 - 902 - 1012 Live webcast and replay: [https://…….] US Toll - Free dial - in: 1 - 877 - 407 - 0619 International dial - in +1 - 412 - 902 - 1012 Live webcast and replay: https://78449.themediaframe.com/dataconf/productusers/ssys/mediaframe/43687/indexl.html Live dial - in information Conference call & webcast details
Forward - looking statements 2 Cautionary Statement Regarding Forward - Looking Statements The statements in this press release regarding Stratasys' strategy, and the statements regarding its projected future financial performance, including the financial guidance concerning its expected results for 2021, are forward - looking statements reflecting management's current expectations and beliefs. These forward - looking statements are based on current information that is, by its nature, subject to rapid and even abrupt change. Due to risks and uncertainties associated with Stratasys' business, actual results could differ materially from those projected or implied by these forward - looking statements. These risks and uncertainties include, but are not limited to: the degree of our success at introducing new or improved products and solutions that gain market share; the degree of growth of the 3D printing market generally; the duration and degree of severity of, and strength of recovery from, the global COVID - 19 pandemic; the impact of potential shifts in the prices or margins of the products that we sell or services that we provide, including due to a shift towards lower margin products or services; the impact of competition and new technologies; the extent of our success at successfully integrating into our existing business, or making additional, acquisitions or investments in new businesses, technologies, products or services; potential changes in our management and board of directors; global market, political and economic conditions, and in the countries in which we operate in particular (including risks related to the impact of coronavirus on our supply chain and business); potential further charges against earnings that we could be required to take due to impairment of additional goodwill or other intangible assets that we have recently acquired or may acquire in the future; costs and potential liability relating to litigation and regulatory proceedings; risks related to infringement of our intellectual property rights by others or infringement of others' intellectual property rights by us; the extent of our success at maintaining our liquidity and financing our operations and capital needs; the impact of tax regulations on our results of operations and financial condition; and those additional factors referred to in Item 3.D “Key Information - Risk Factors”, Item 4, “Information on the Company”, Item 5, “Operating and Financial Review and Prospects,” and all other parts of our Annual Report on Form 20 - F for the year ended December 31, 2020 (the “ 2020 Annual Report ”), which we expect to file with the Securities and Exchange Commission (the “ SEC ”) on March 1, 2021. Readers are urged to carefully review and consider the various disclosures made throughout our 2020 Annual Report and the Reports of Foreign Private Issuer on Form 6 - K that will attach Stratasys’ unaudited, condensed consolidated financial statements and its review of its results of operations and financial condition, for the quarterly periods throughout 2021, which will be furnished to the SEC over the course of 2021, and our other reports filed with or furnished to the SEC, which are designed to advise interested parties of the risks and factors that may affect our business, financial condition, results of operations and prospects. Any guidance provided, and other forward - looking statements made, in this press release are made as of the date hereof, and Stratasys undertakes no obligation to publicly update or revise any forward - looking statements, whether as a result of new information, future events or otherwise, except as required by law.
Use of non - GAAP financial information 3 Use of non - GAAP financial measures The non - GAAP data included herein, which excludes certain items as described below, are non - GAAP financial measures. Our management believes that these non - GAAP financial measures are useful information for investors and shareholders of our Company in gauging our results of operations (x) on an ongoing basis after excluding mergers, acquisitions and divestments related expense or gains and reorganization - related charges or gains, and (y) excluding non - cash items such as stock - based compensation expenses, acquired intangible assets amortization, including intangible assets amortization related to equity method investments, impairment of long - lived assets, and the corresponding tax effect of those items. These non - GAAP adjustments either do not reflect actual cash outlays that impact our liquidity and our financial condition or have a non - recurring impact on the statement of operations, as assessed by management. These non - GAAP financial measures are presented to permit investors to more fully understand how management assesses our performance for internal planning and forecasting purposes. The limitations of using these non - GAAP financial measures as performance measures are that they provide a view of our results of operations without including all items indicated above during a period, which may not provide a comparable view of our performance to other companies in our industry. Investors and other readers should consider non - GAAP measures only as supplements to, not as substitutes for or as superior measures to, the measures of financial performance prepared in accordance with GAAP. Reconciliation between results on a GAAP and non - GAAP basis is provided in a table below.

Agenda 1 | Annual review 2 | Financial highlights
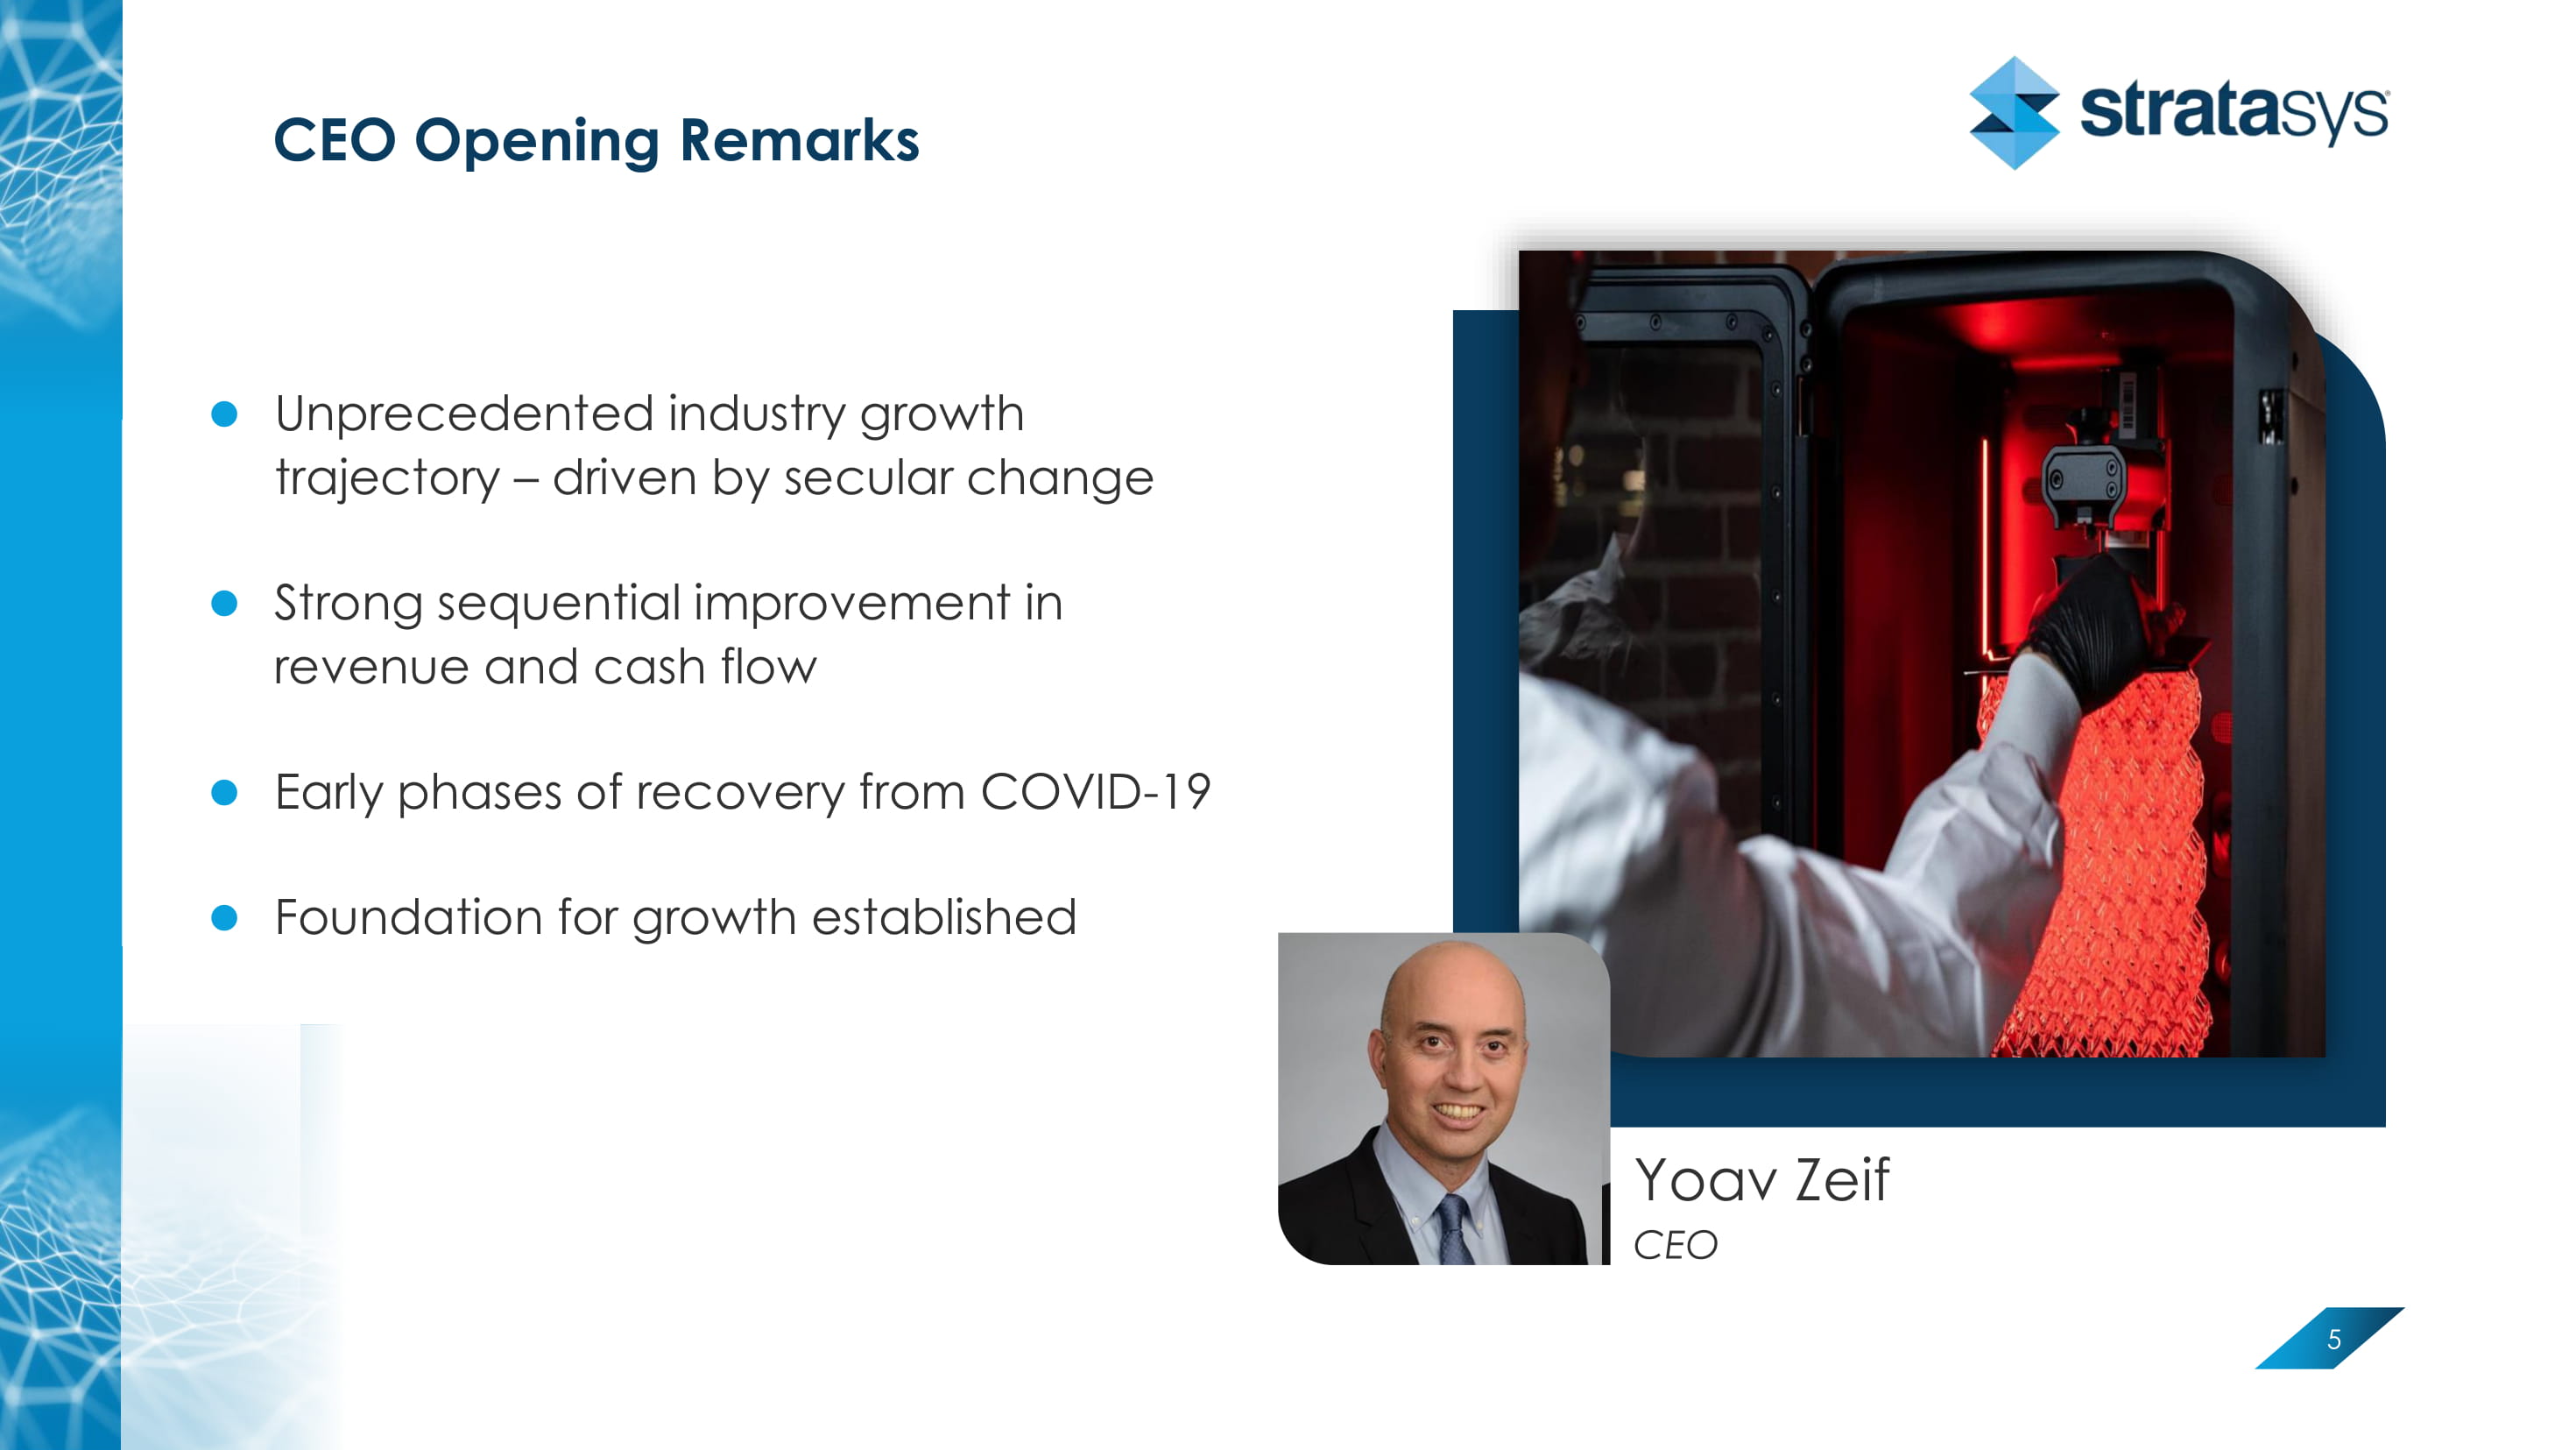
CEO Opening Remarks 5 Unprecedented industry growth trajectory – driven by secular change Strong sequential improvement in revenue and cash flow Early phases of recovery from COVID - 19 Foundation for growth established Yoav Zeif CEO
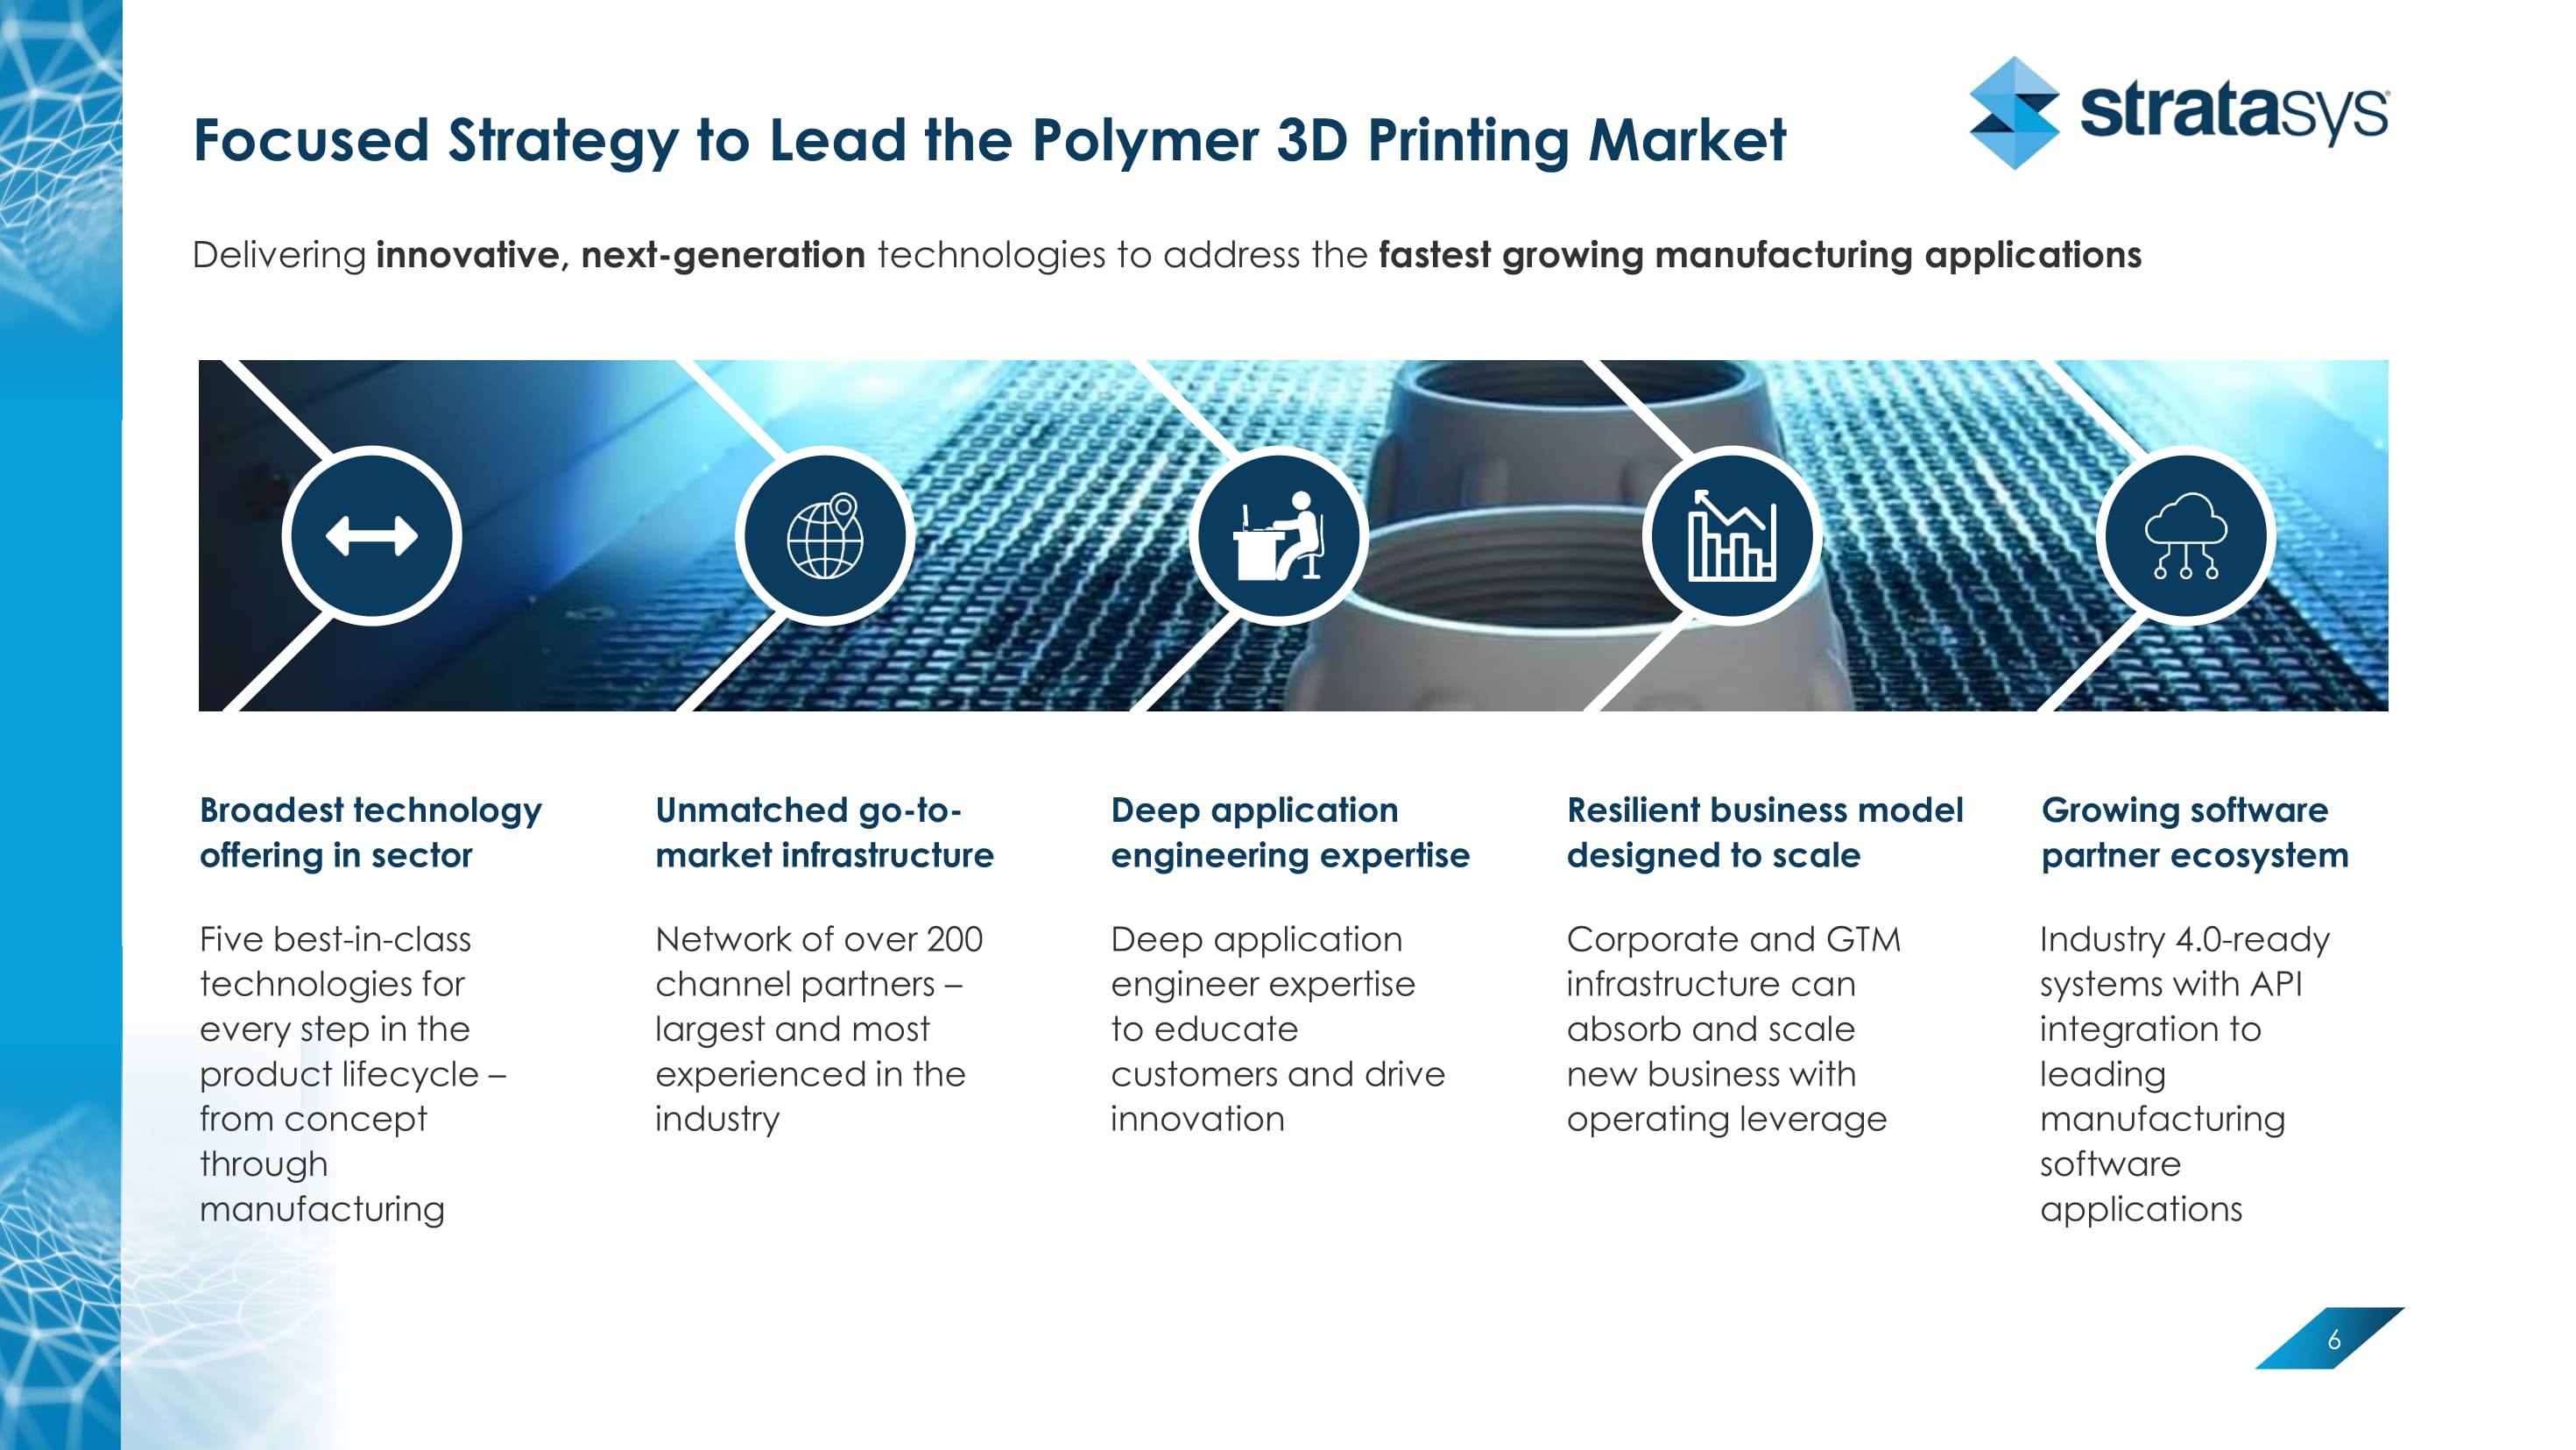
Focused Strategy to Lead the Polymer 3D Printing Market 6 Broadest technology offering in sector Deep application engineering expertise Unmatched go - to - market infrastructure Resilient business model designed to scale Growing software partner ecosystem Five best - in - class technologies for every step in the product lifecycle – from concept through manufacturing Network of over 200 channel partners – largest and most experienced in the industry Deep application engineer expertise to educate customers and drive innovation Corporate and GTM infrastructure can absorb and scale new business with operating leverage Industry 4.0 - ready systems with API integration to leading manufacturing software applications Delivering innovative, next - generation technologies to address the fastest growing manufacturing applications
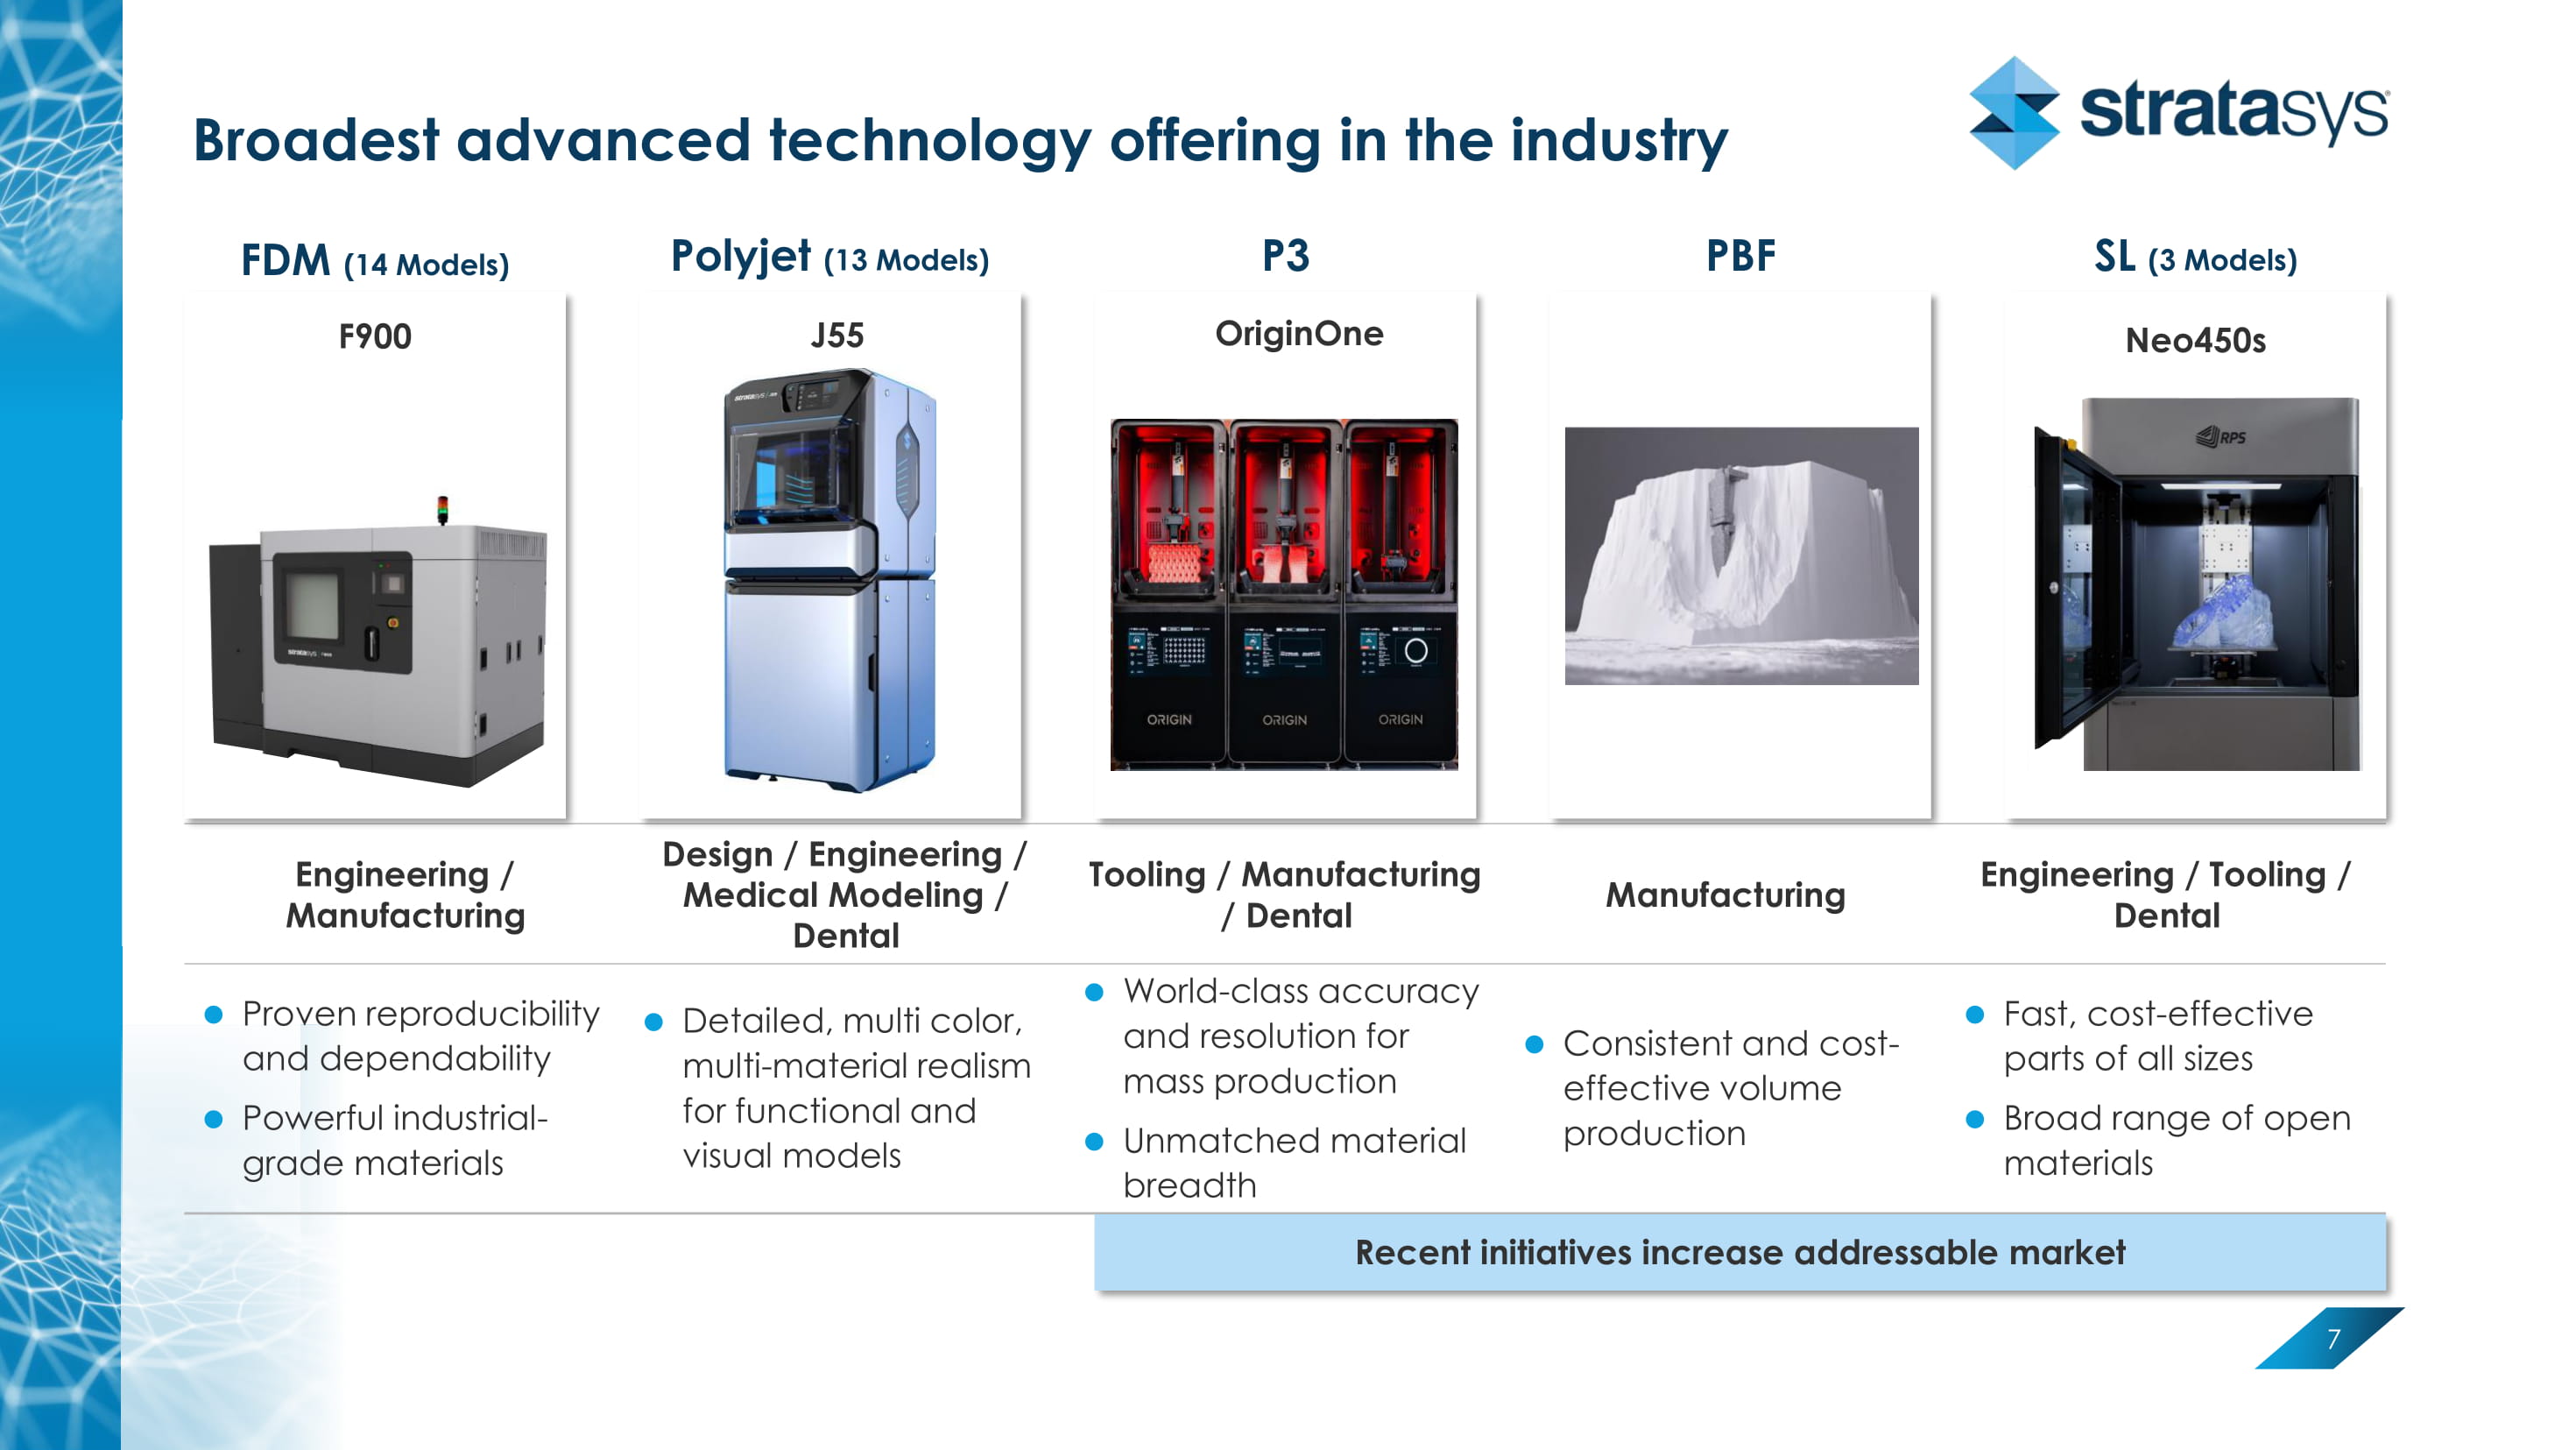
Broadest advanced technology offering in the industry 7 Engineering / Manufacturing Design / Engineering / Medical Modeling / Dental Tooling / Manufacturing / Dental Manufacturing Engineering / Tooling / Dental Proven reproducibility and dependability Powerful industrial - grade materials Detailed, multi color, multi - material realism for functional and visual models World - class accuracy and resolution for mass production Unmatched material breadth Consistent and cost - effective volume production Fast, cost - effective parts of all sizes Broad range of open materials P3 PBF SL (3 Models) FDM (14 Models) Polyjet (13 Models) Neo450s F900 J55 OriginOne Recent initiatives increase addressable market
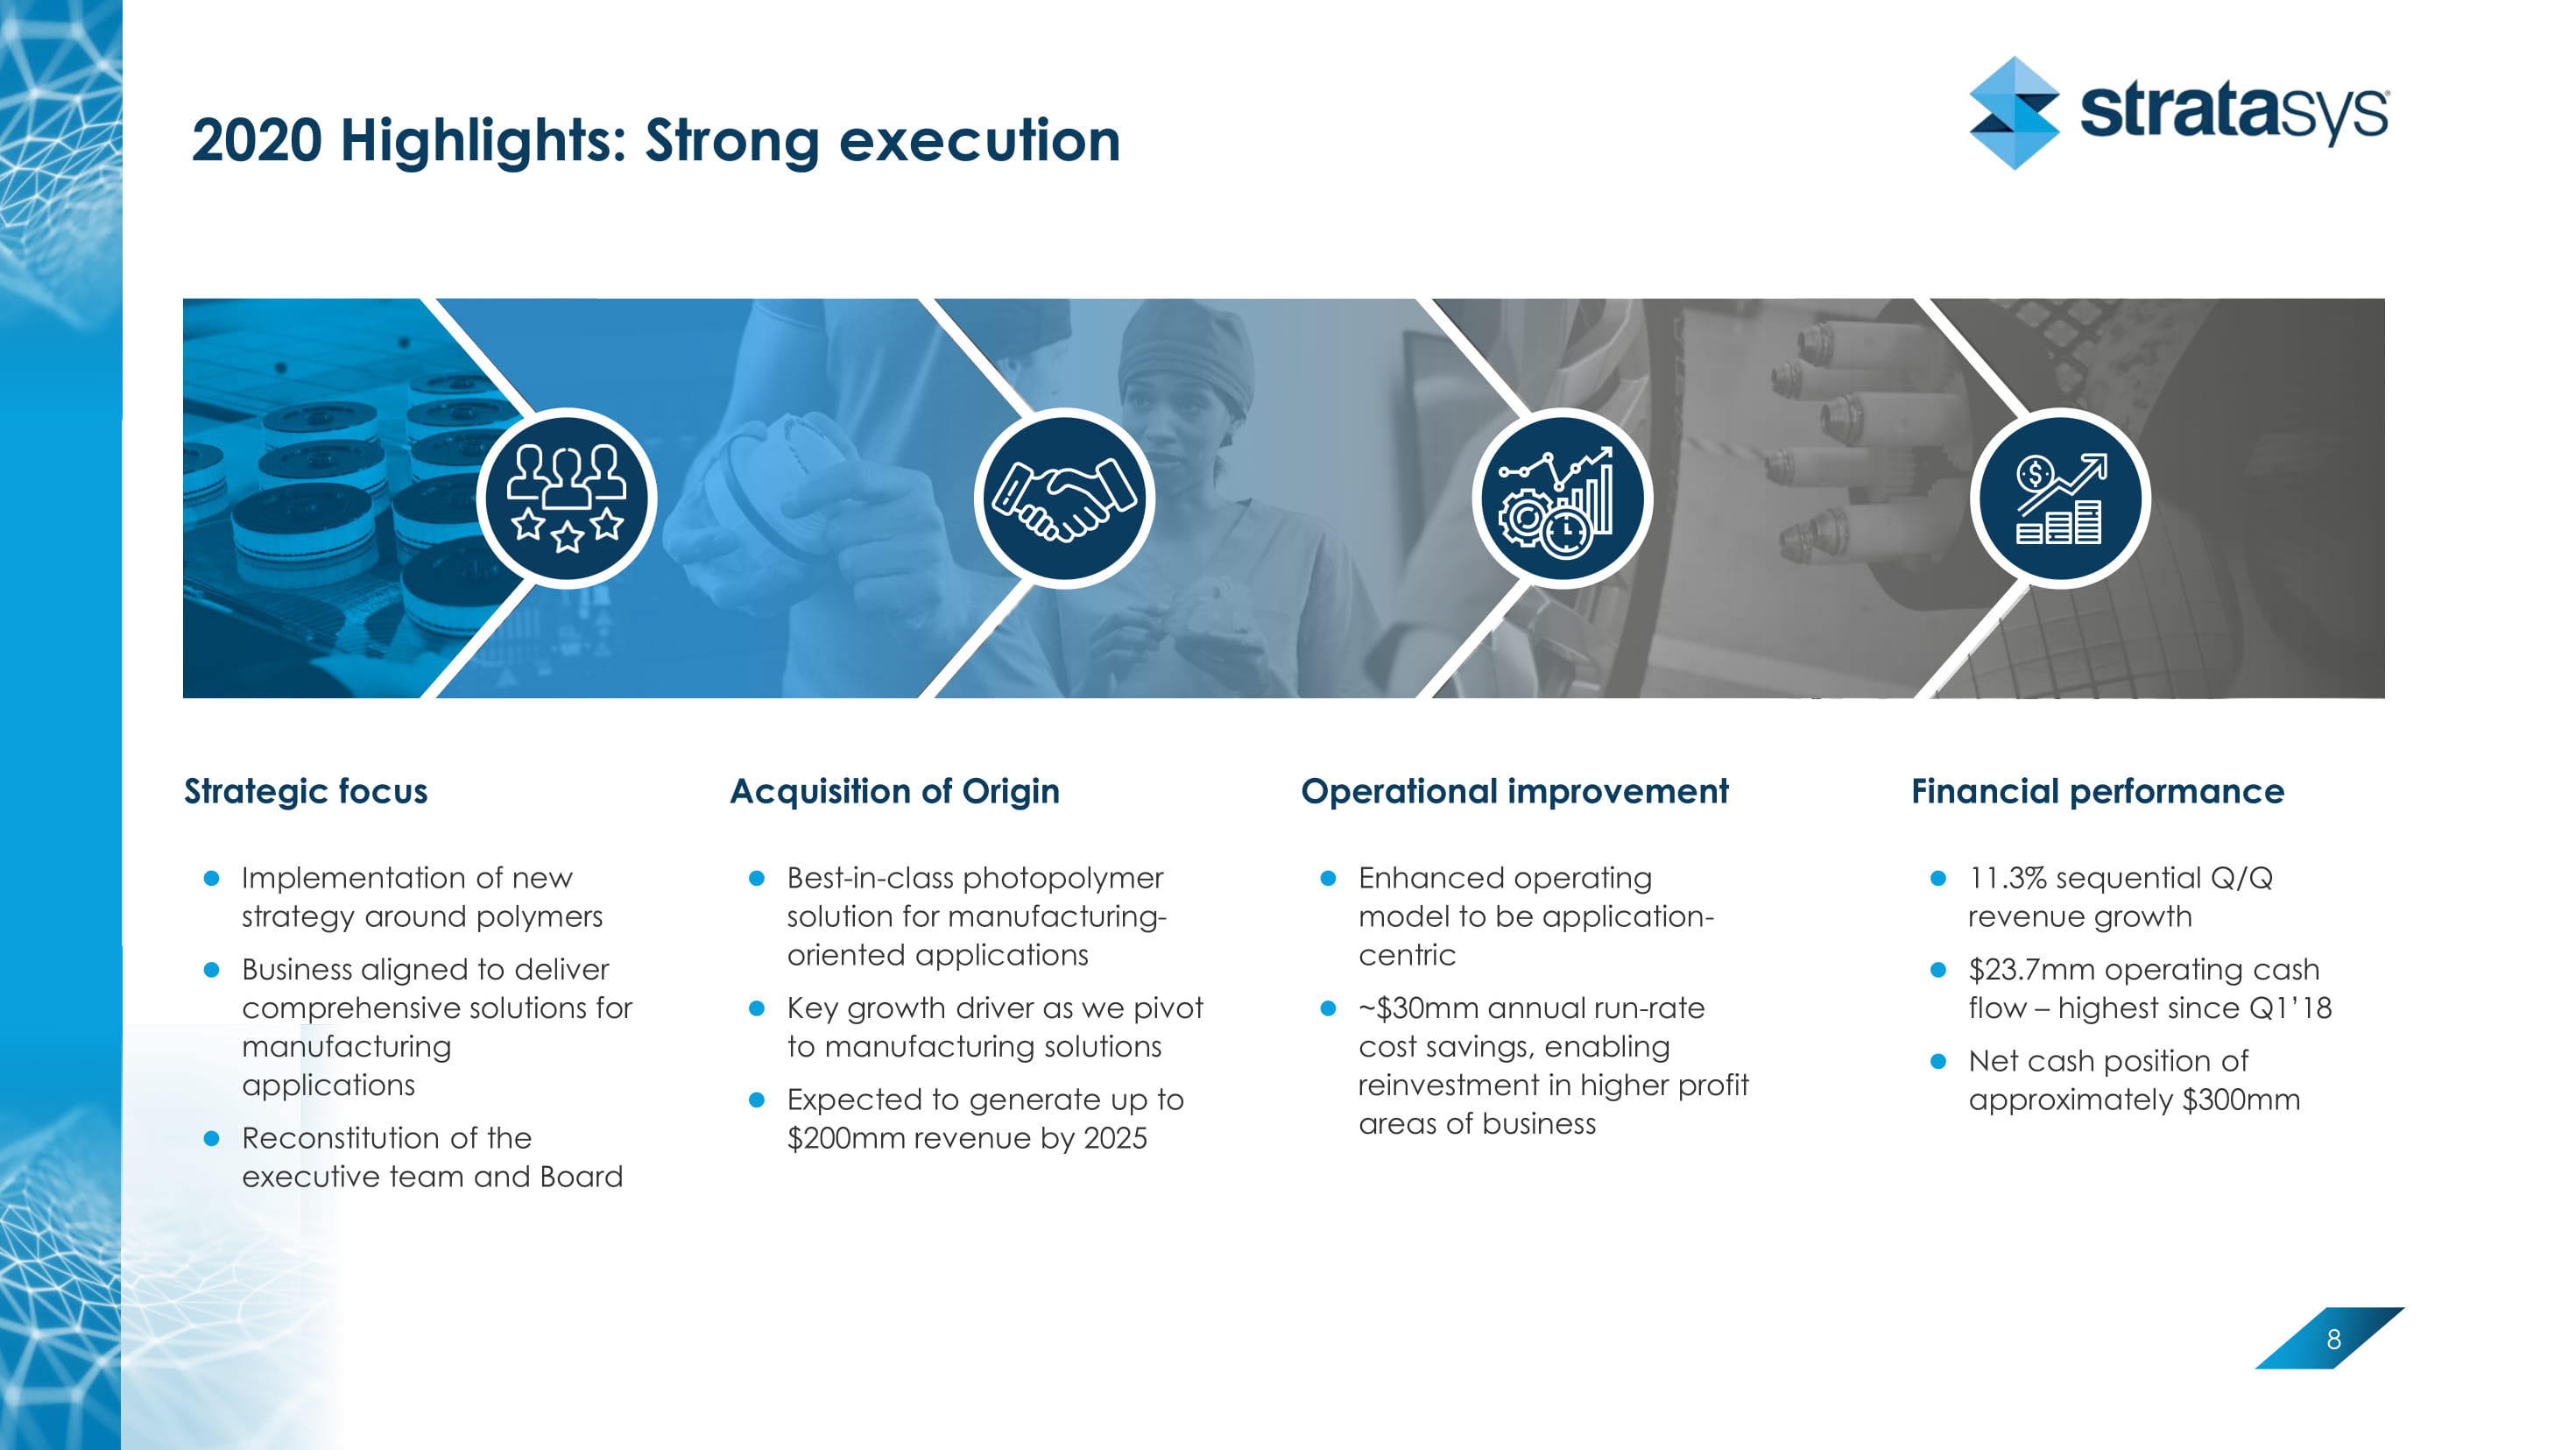
2020 Highlights: Strong execution 8 Strategic focus Acquisition of Origin Operational improvement Financial performance Implementation of new strategy around polymers Business aligned to deliver comprehensive solutions for manufacturing applications Reconstitution of the executive team and Board Best - in - class photopolymer solution for manufacturing - oriented applications Key growth driver as we pivot to manufacturing solutions Expected to generate up to $ 200 mm revenue by 2025 Enhanced operating model to be application - centric ~$30mm annual run - rate cost savings, enabling reinvestment in higher profit areas of business 11.3% sequential Q/Q revenue growth $ 23.7mm operating cash flow – highest since Q1’18 Net cash position of approximately $300mm
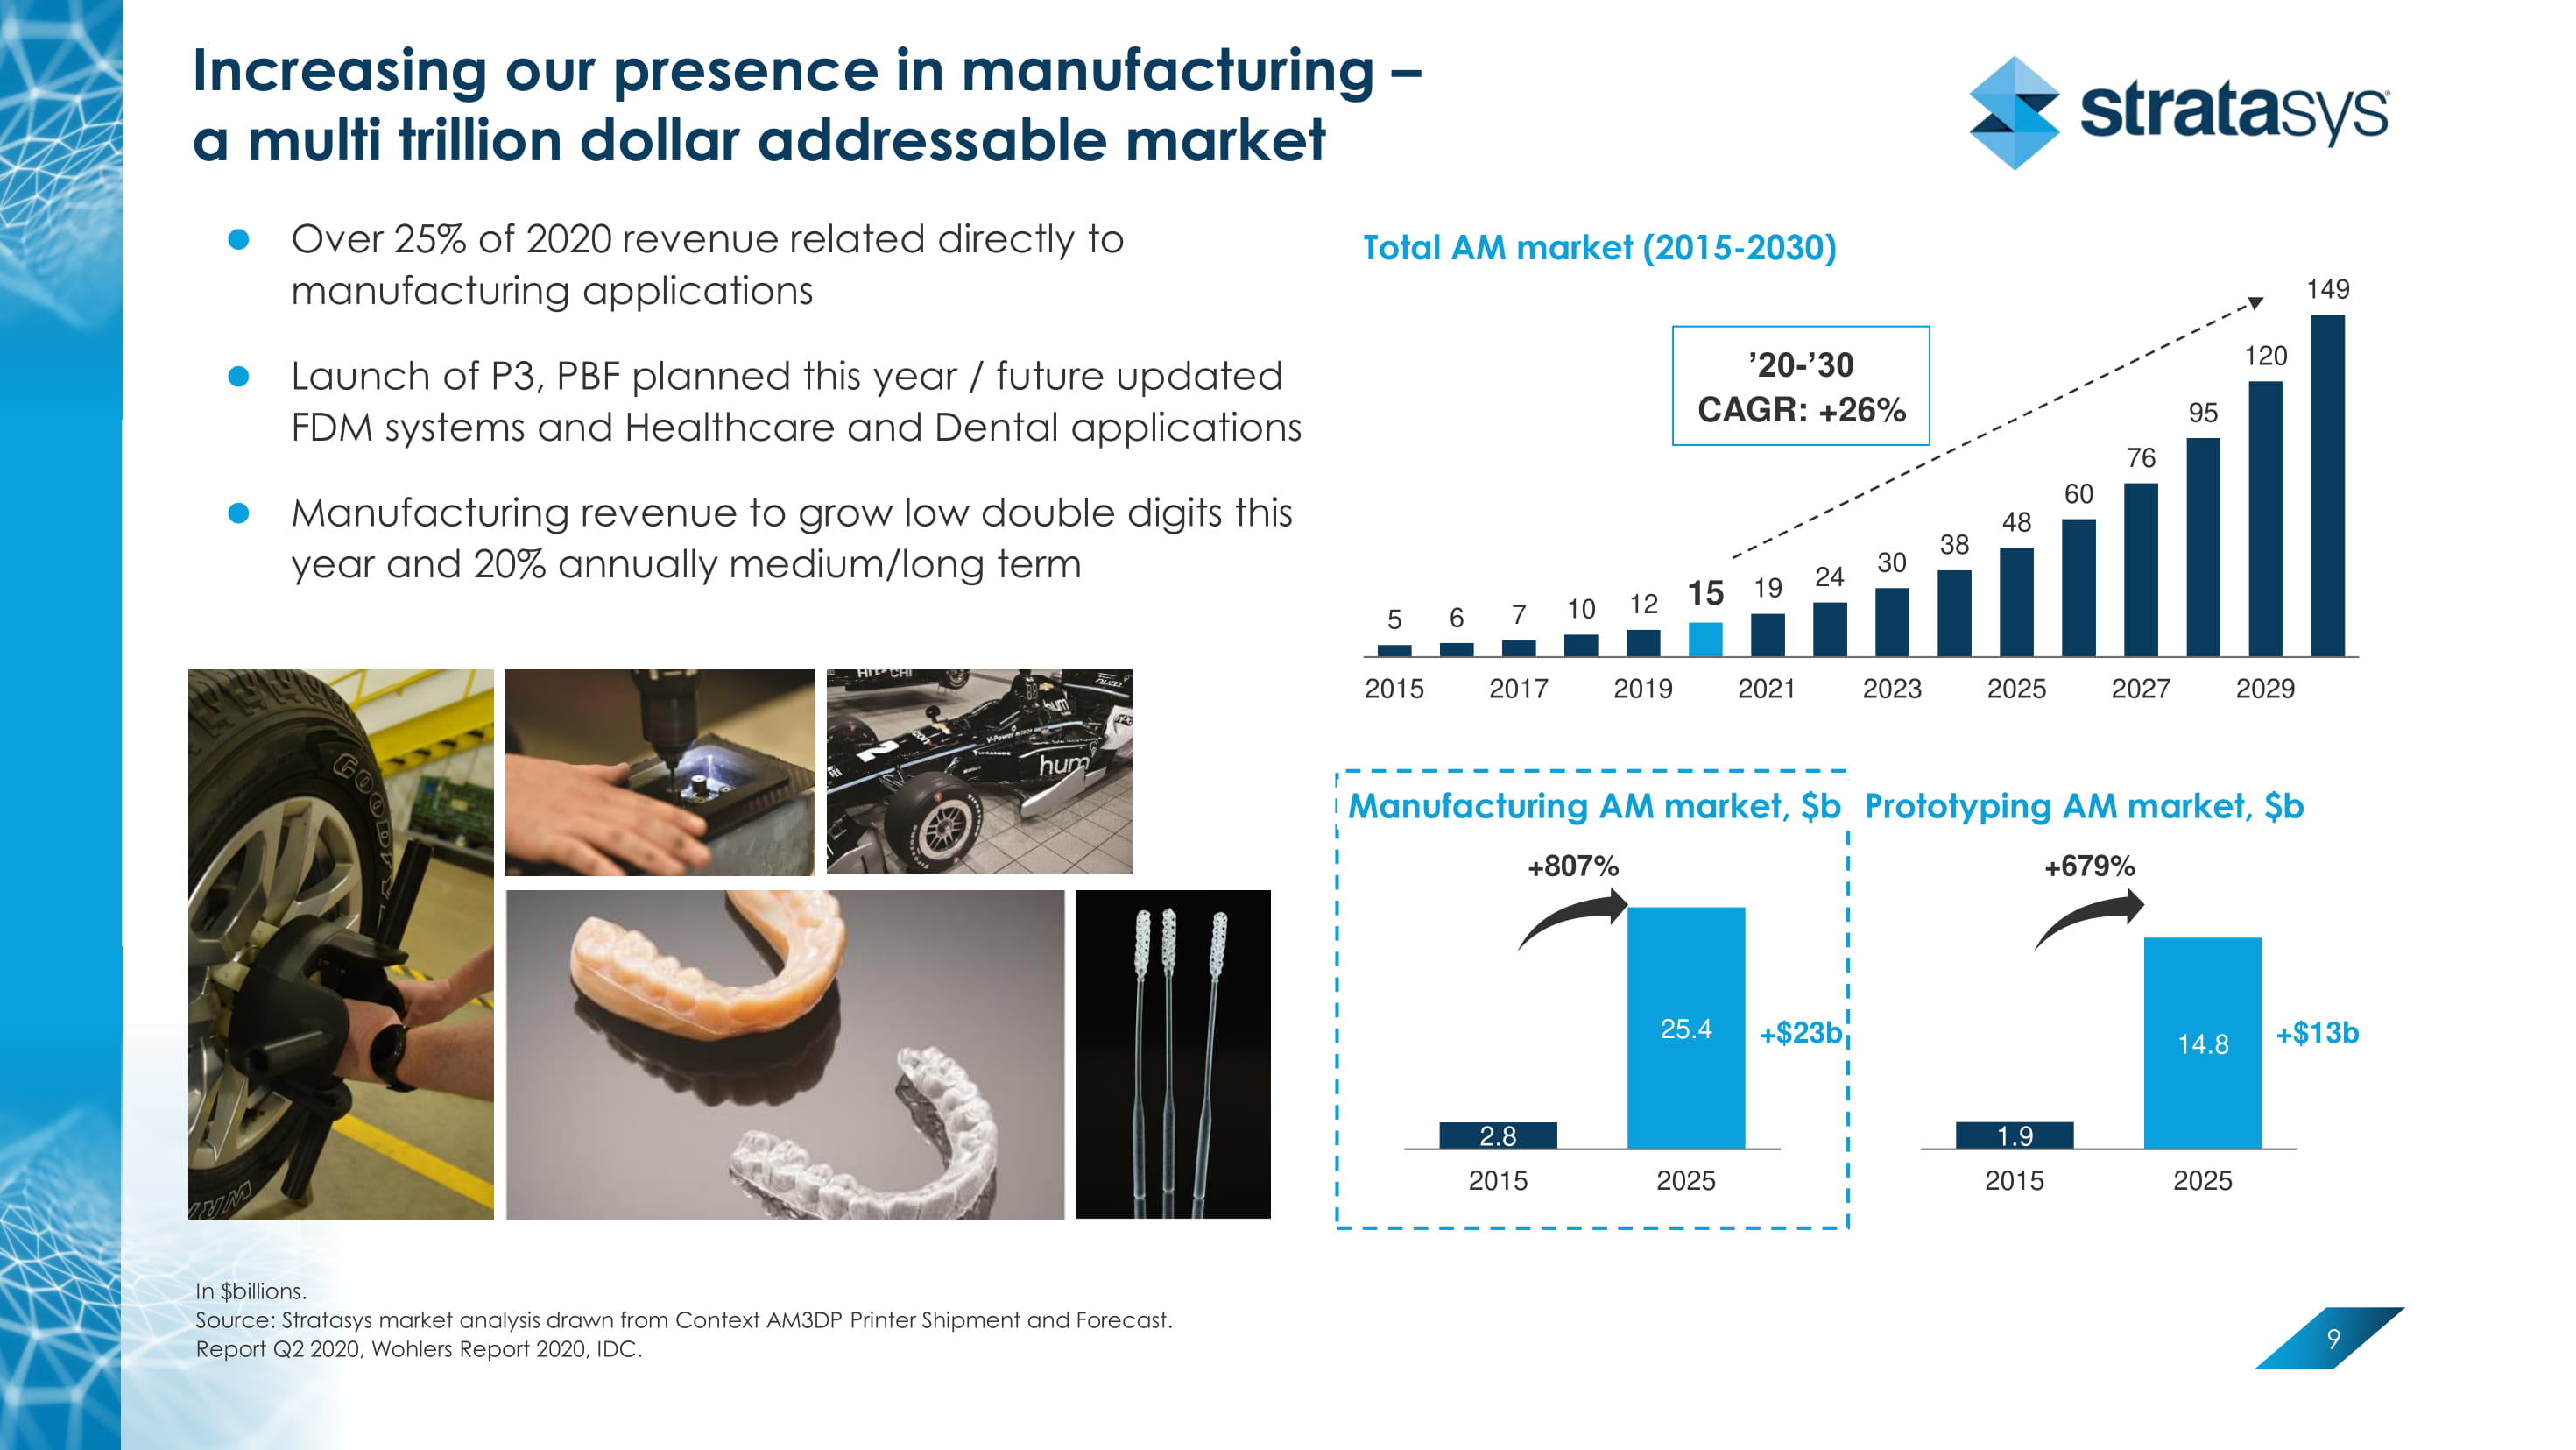
Increasing our presence in manufacturing – a multi trillion dollar addressable market 9 Over 25% of 2020 revenue related directly to manufacturing applications Launch of P3, PBF planned this year / future updated FDM systems and Healthcare and Dental applications Manufacturing revenue to grow low double digits this year and 20% annually medium/long term 2.8 25.4 2015 2025 Manufacturing AM market, $b +$23b +807% 1.9 14.8 2015 2025 Prototyping AM market, $b +$13b +679% 5 6 7 10 12 15 19 24 30 38 48 60 76 95 120 149 2015 2017 2019 2021 2023 2025 2027 2029 ’20 - ’30 CAGR: +26% In $billions. Source: Stratasys market analysis drawn from Context AM3DP Printer Shipment and Forecast. Report Q2 2020, Wohlers Report 2020, IDC. Total AM market (2015 - 2030)
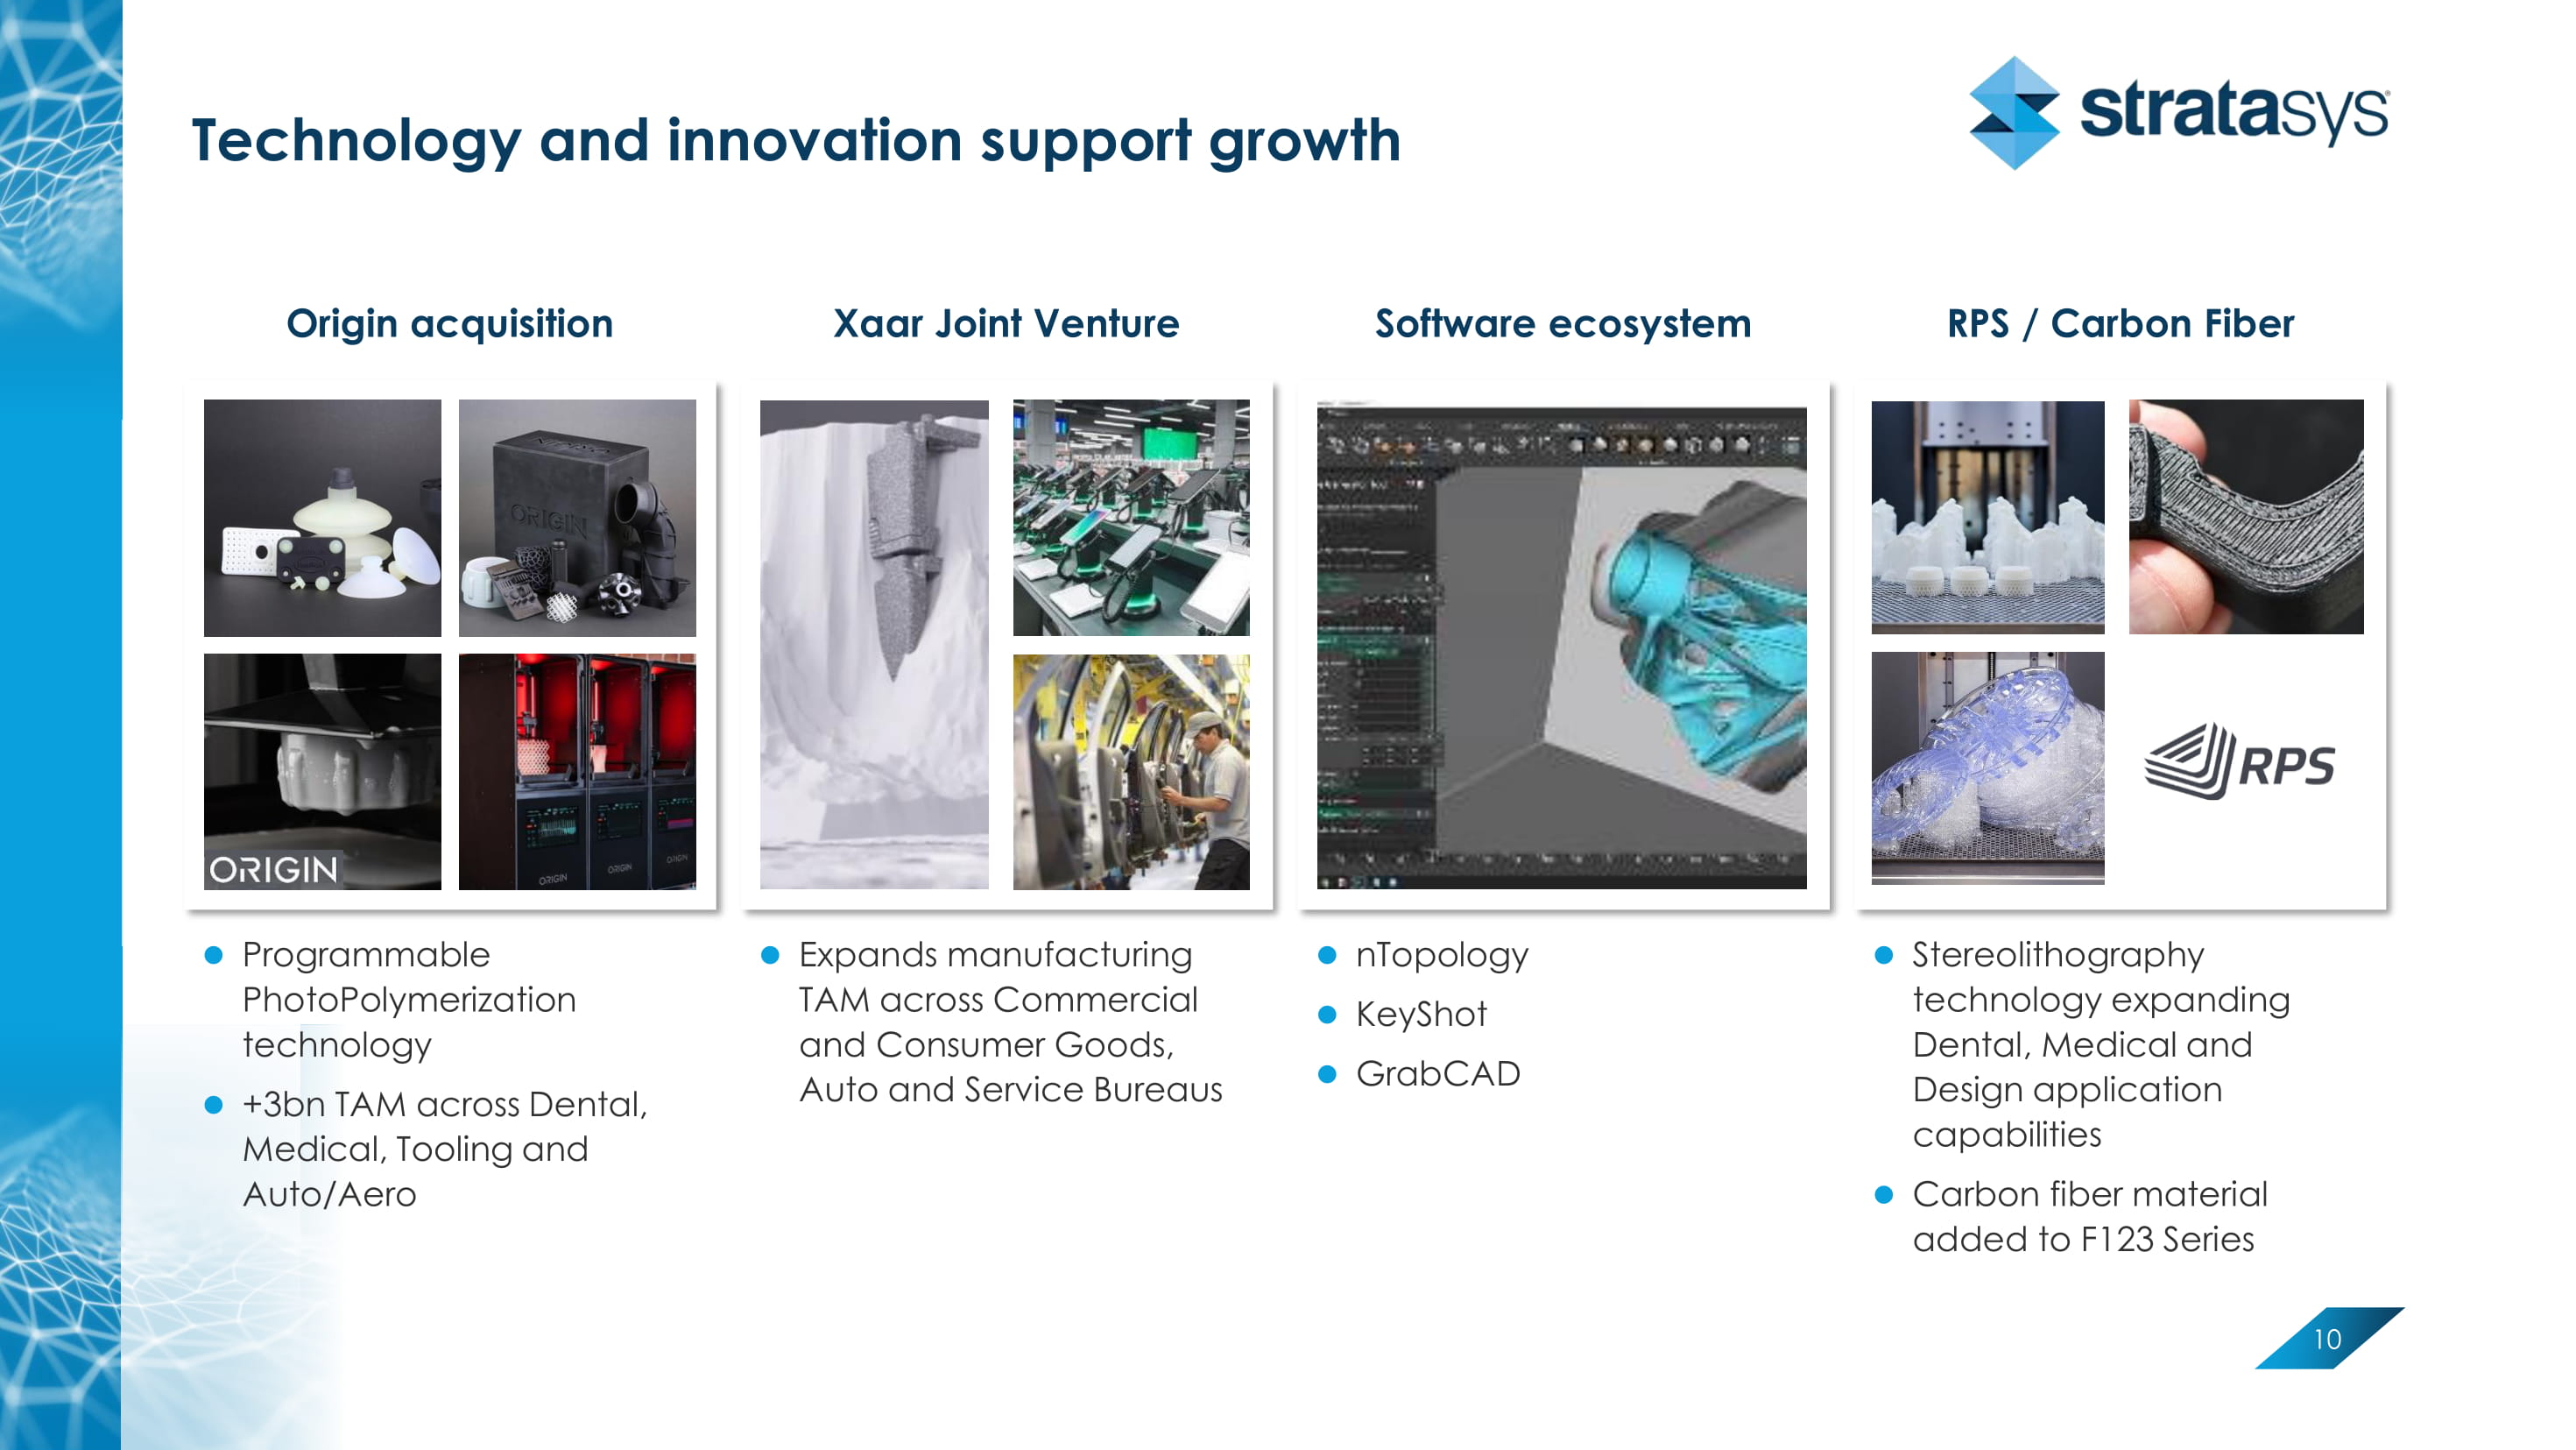
Technology and innovation support growth 10 Programmable PhotoPolymerization technology + 3 bn TAM across Dental, Medical, Tooling and Auto/Aero Expands manufacturing TAM across Commercial and Consumer Goods, Auto and Service Bureaus nTopology KeyShot GrabCAD Origin acquisition Xaar Joint Venture Software ecosystem RPS / Carbon Fiber Stereolithography technology expanding Dental, Medical and Design application capabilities Carbon fiber material added to F123 Series
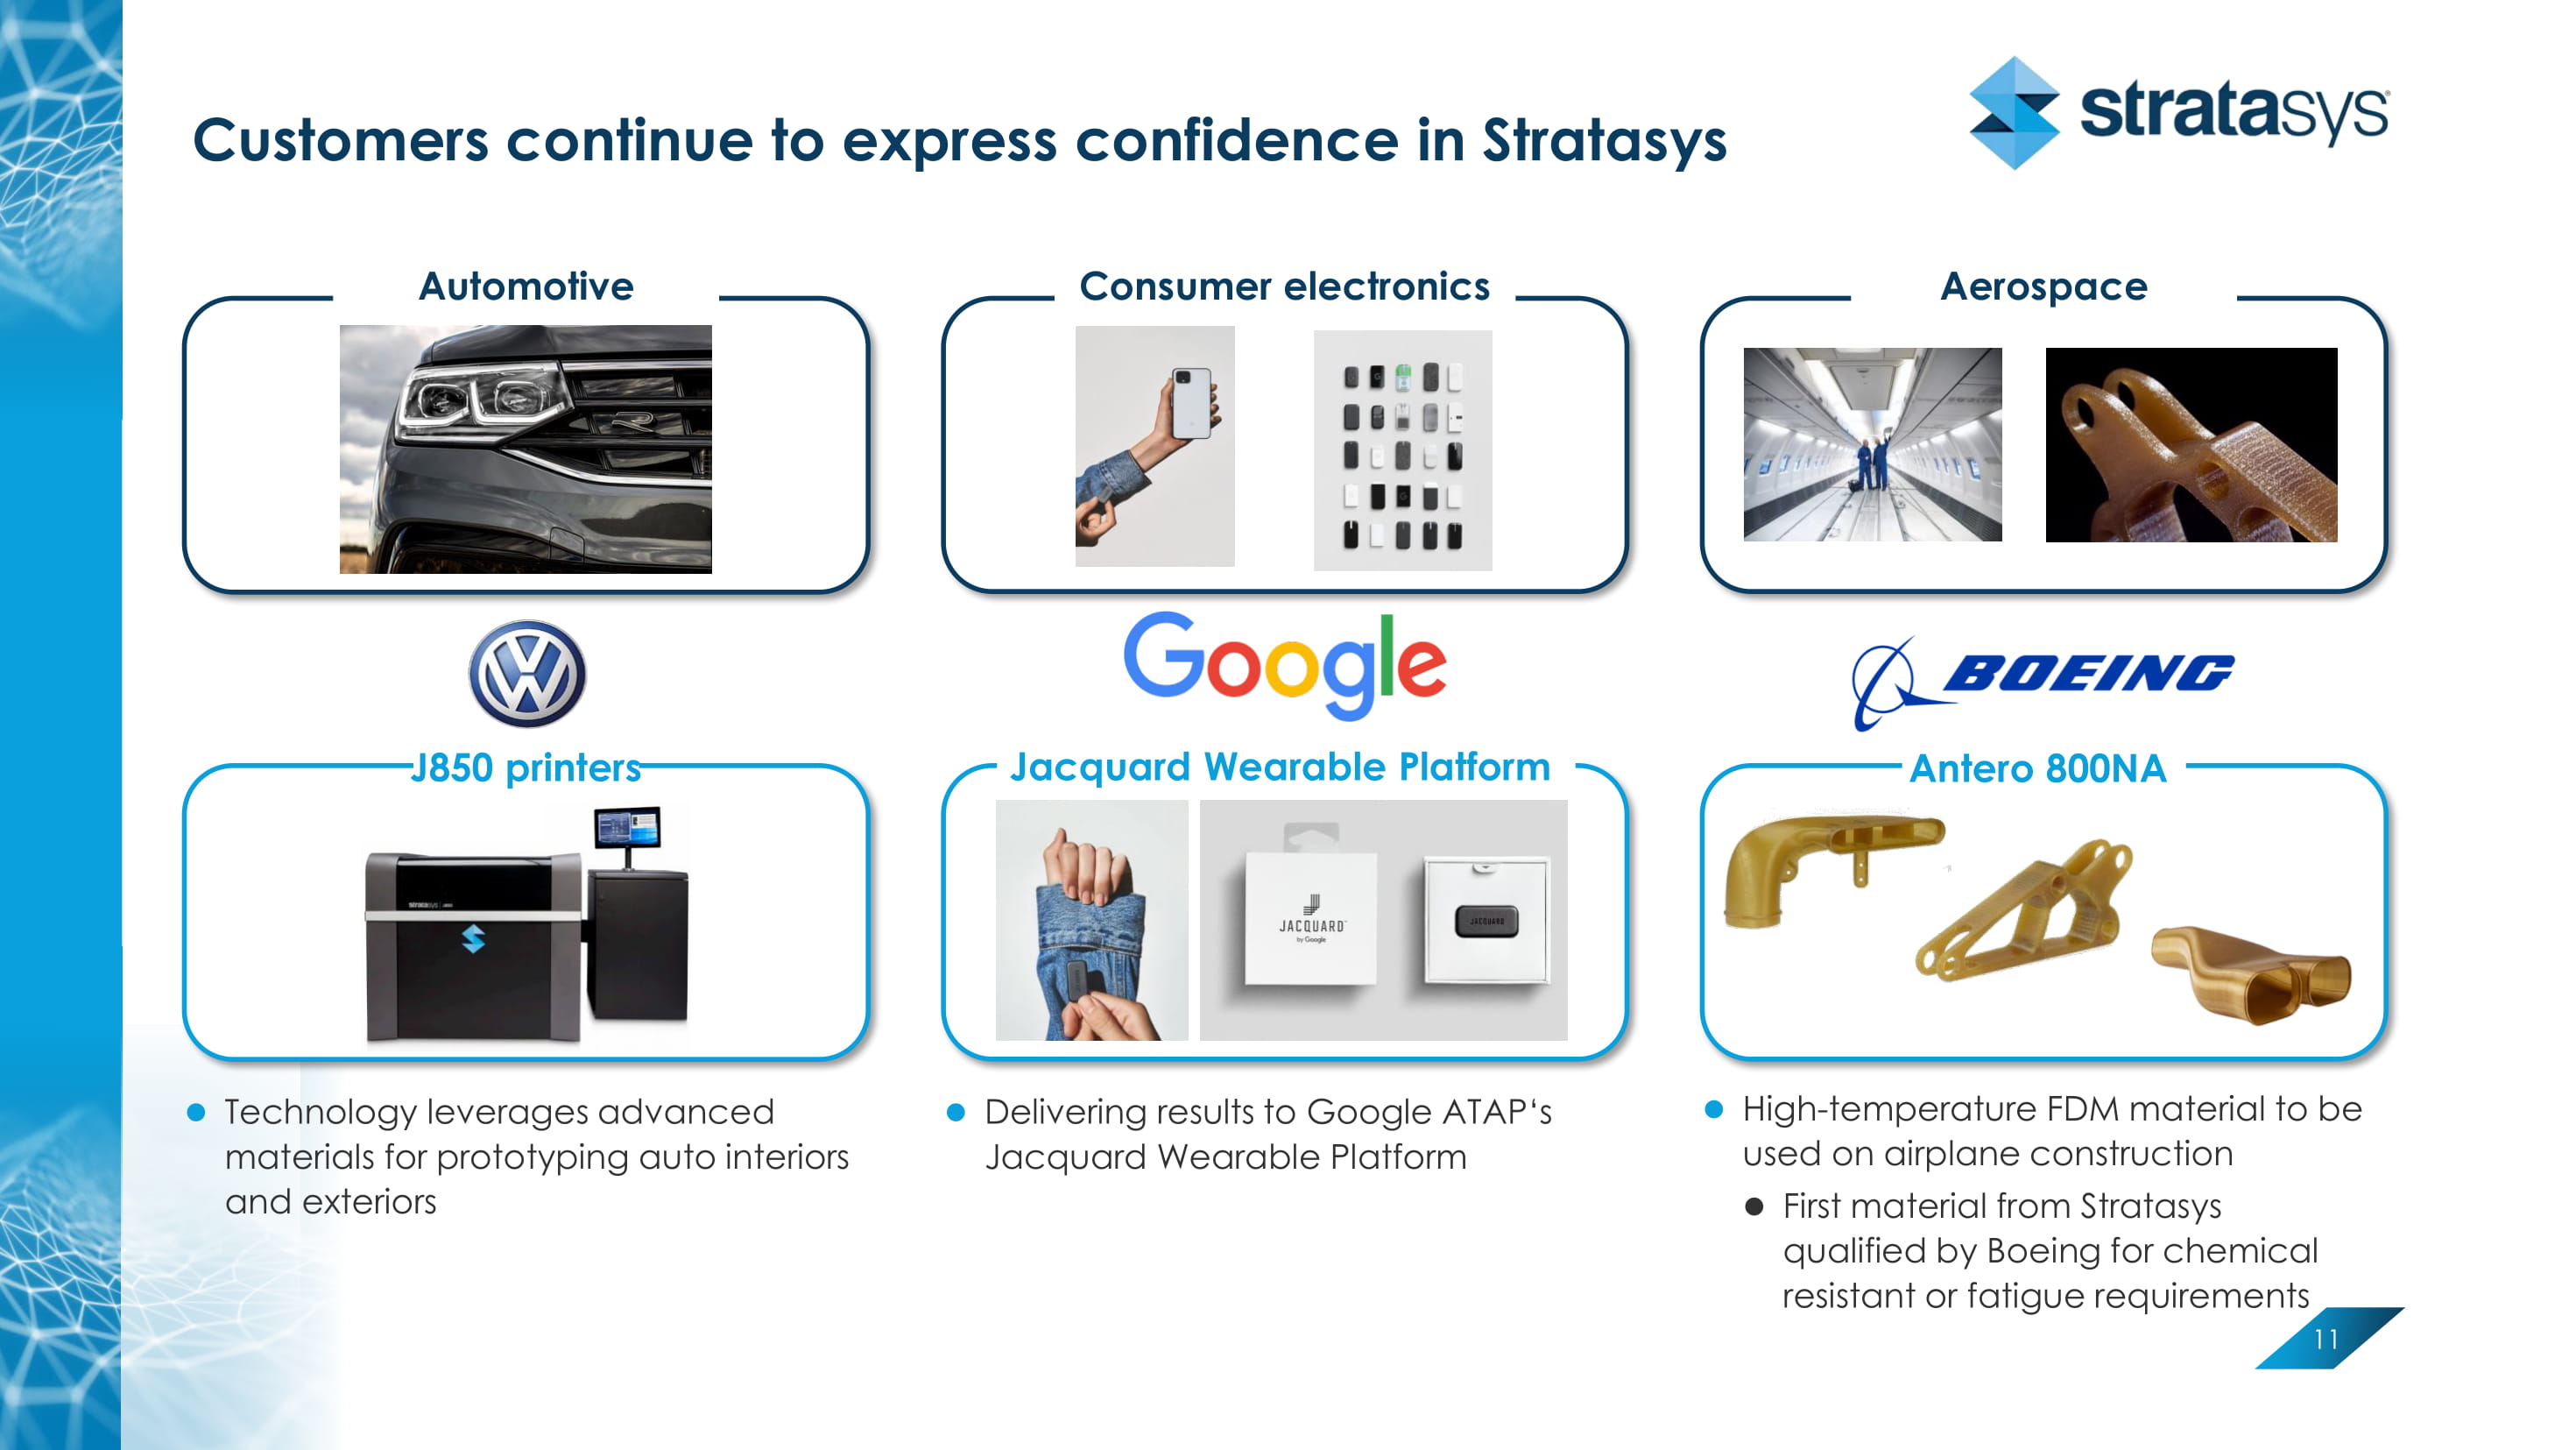
Customers continue to express confidence in Stratasys 11 Technology leverages advanced materials for prototyping auto interiors and exteriors Antero 800NA J850 printers Jaquard Wearable Platform Delivering results to Google ATAP‘s Jacquard Wearable Platform High - temperature FDM material to be used on airplane construction First material from Stratasys qualified by Boeing for chemical resistant or fatigue requirements Automotive Consumer electronics Aerospace Jacquard Wearable Platform
Financial highlights Lilach Payorski CFO Solid H 2 sequential recovery Improved revenue, gross margins and cash generation Good signs of economic recovery
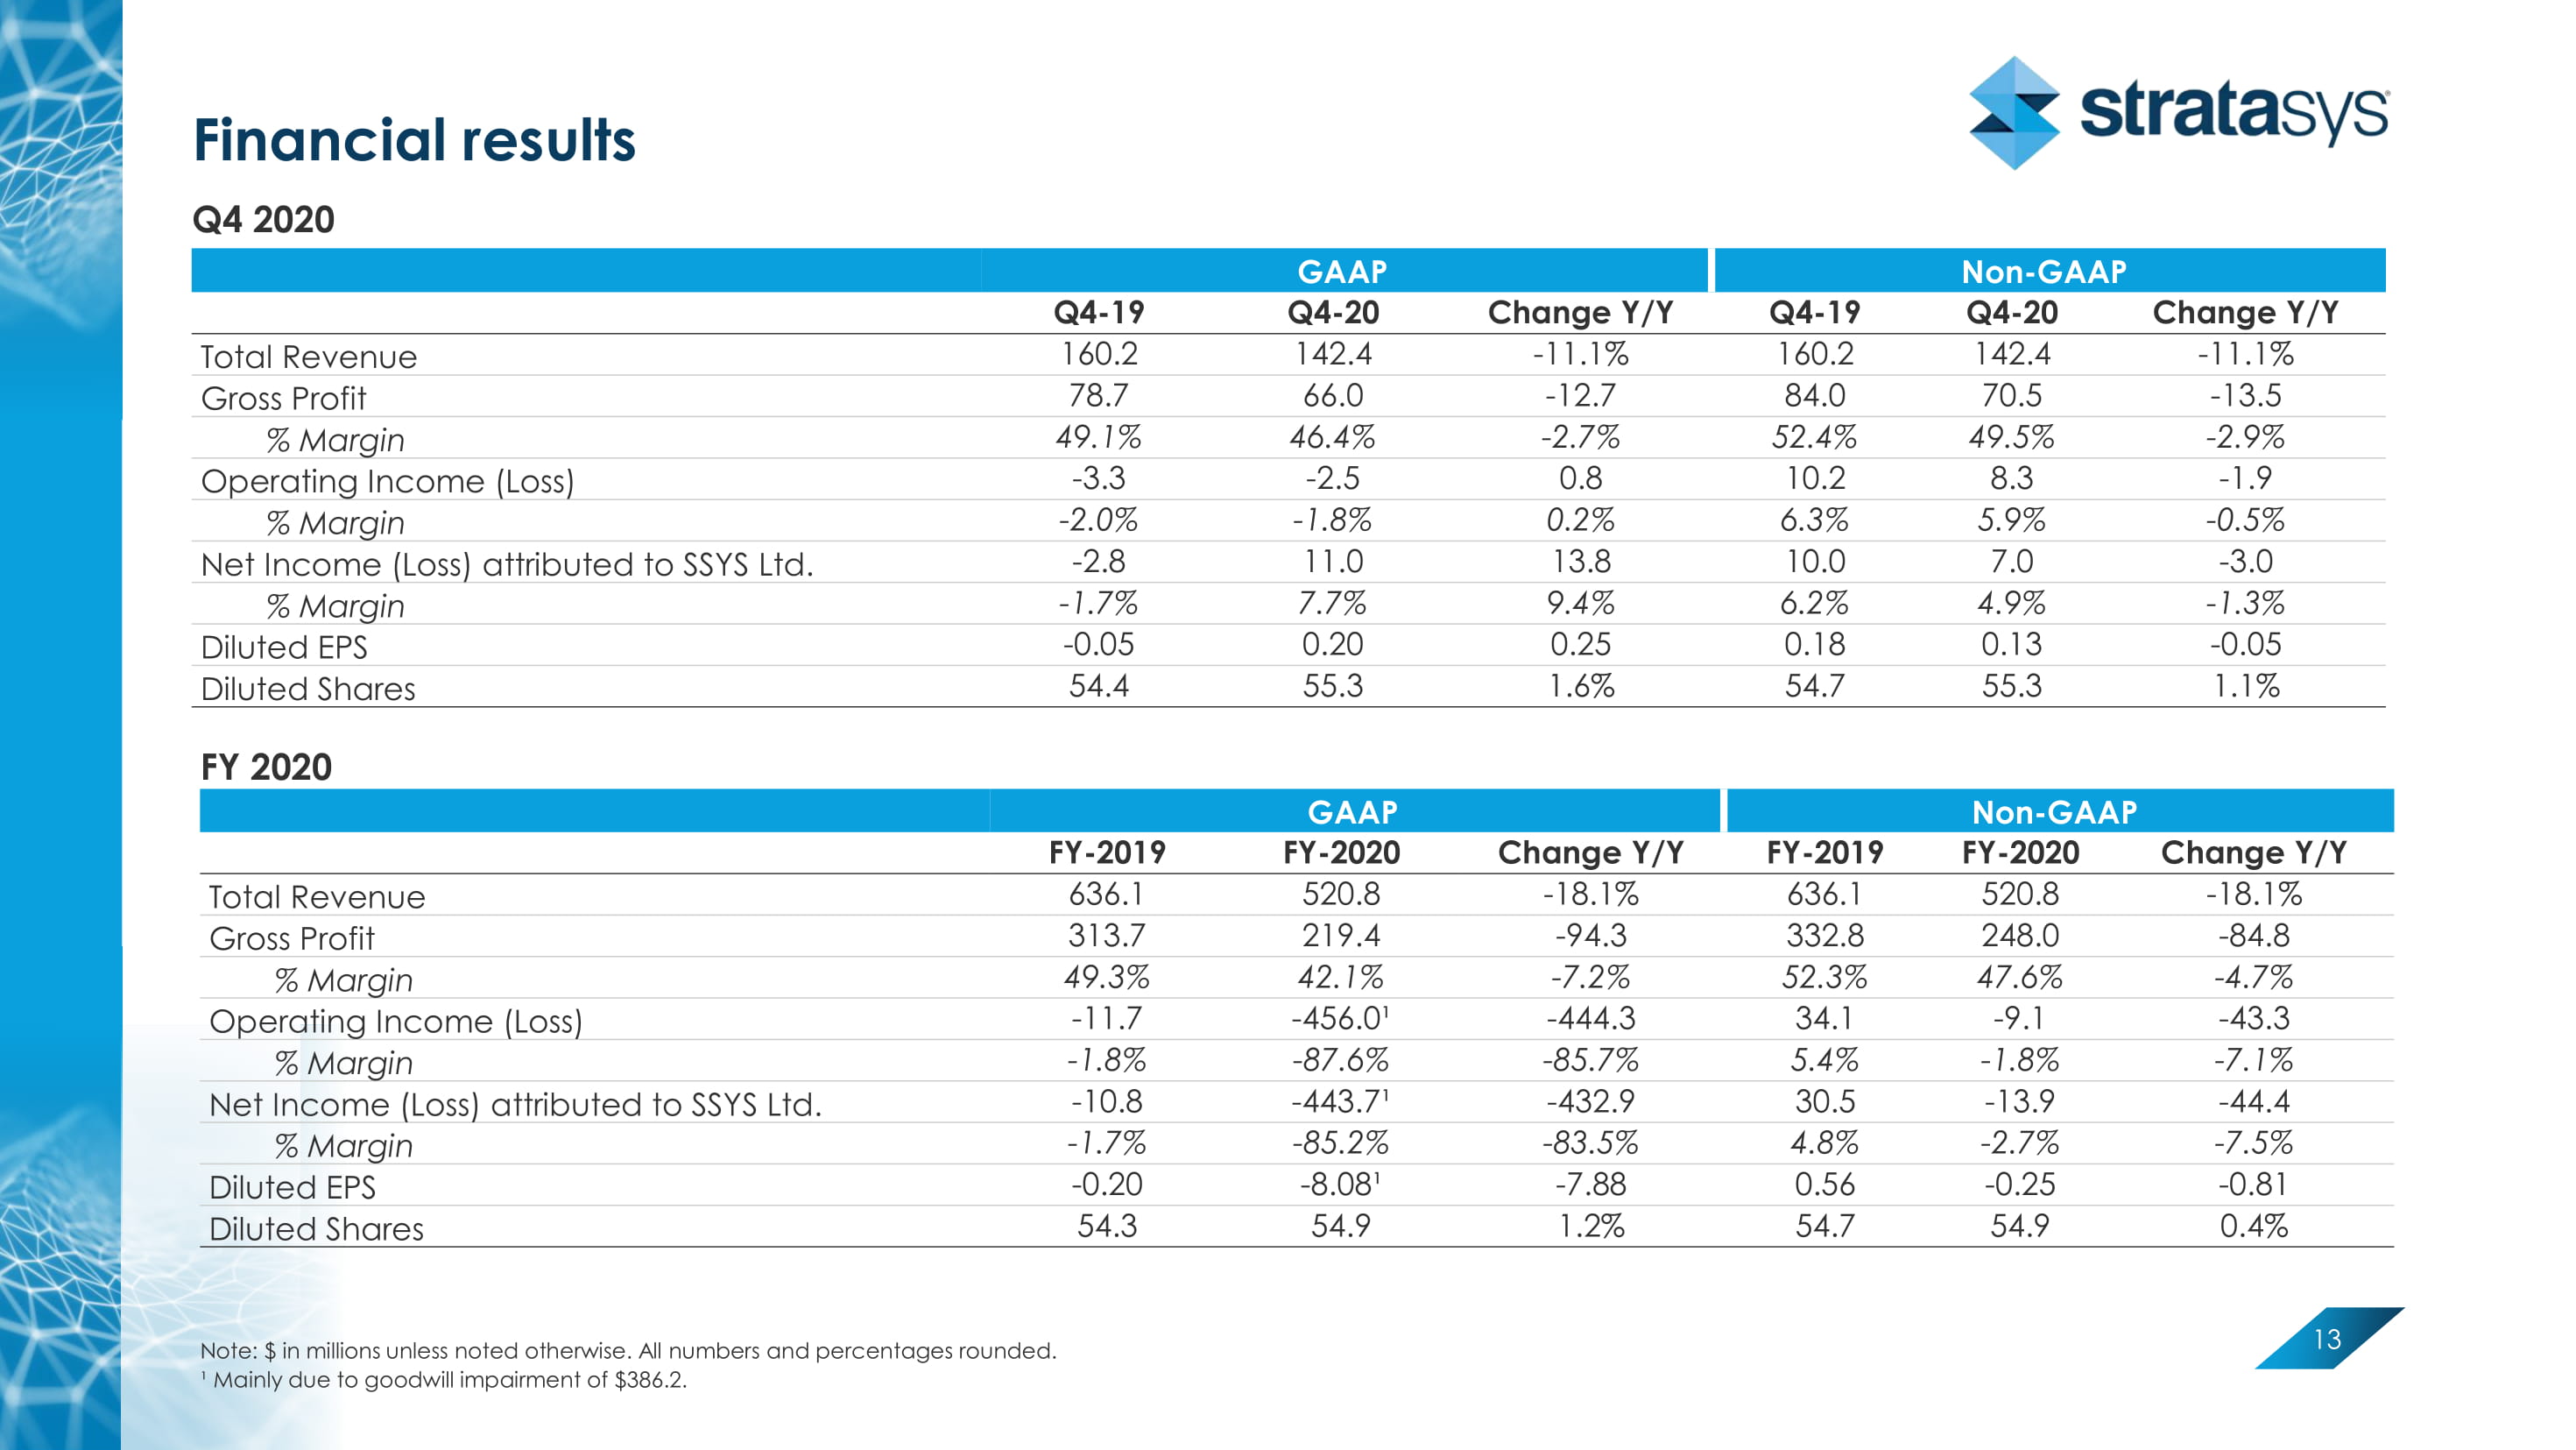
Financial results Q4 2020 13 GAAP Non - GAAP Q4 - 19 Q4 - 20 Change Y/Y Q4 - 19 Q4 - 20 Change Y/Y Total Revenue 160.2 142.4 - 11.1% 160.2 142.4 - 11.1% Gross Profit 78.7 66.0 - 12.7 84.0 70.5 - 13.5 % Margin 49.1% 46.4% - 2.7% 52.4% 49.5% - 2.9% Operating Income (Loss) - 3.3 - 2.5 0.8 10.2 8.3 - 1.9 % Margin - 2.0% - 1.8% 0.2% 6.3% 5.9% - 0.5% Net Income (Loss) attributed to SSYS Ltd. - 2.8 11.0 13.8 10.0 7.0 - 3.0 % Margin - 1.7% 7.7% 9.4% 6.2% 4.9% - 1.3% Diluted EPS - 0.05 0.20 0.25 0.18 0.13 - 0.05 Diluted Shares 54.4 55.3 1.6% 54.7 55.3 1.1% FY 2020 GAAP Non - GAAP FY - 2019 FY - 2020 Change Y/Y FY - 2019 FY - 2020 Change Y/Y Total Revenue 636.1 520.8 - 18.1% 636.1 520.8 - 18.1% Gross Profit 313.7 219.4 - 94.3 332.8 248.0 - 84.8 % Margin 49.3% 42.1% - 7.2% 52.3% 47.6% - 4.7% Operating Income (Loss) - 11.7 - 456.0¹ - 444.3 34.1 - 9.1 - 43.3 % Margin - 1.8% - 87.6% - 85.7% 5.4% - 1.8% - 7.1% Net Income (Loss) attributed to SSYS Ltd. - 10.8 - 443.7¹ - 432.9 30.5 - 13.9 - 44.4 % Margin - 1.7% - 85.2% - 83.5% 4.8% - 2.7% - 7.5% Diluted EPS - 0.20 - 8.08¹ - 7.88 0.56 - 0.25 - 0.81 Diluted Shares 54.3 54.9 1.2% 54.7 54.9 0.4% Note: $ in millions unless noted otherwise. All numbers and percentages rounded. ¹ Mainly due to goodwill impairment of $386.2.
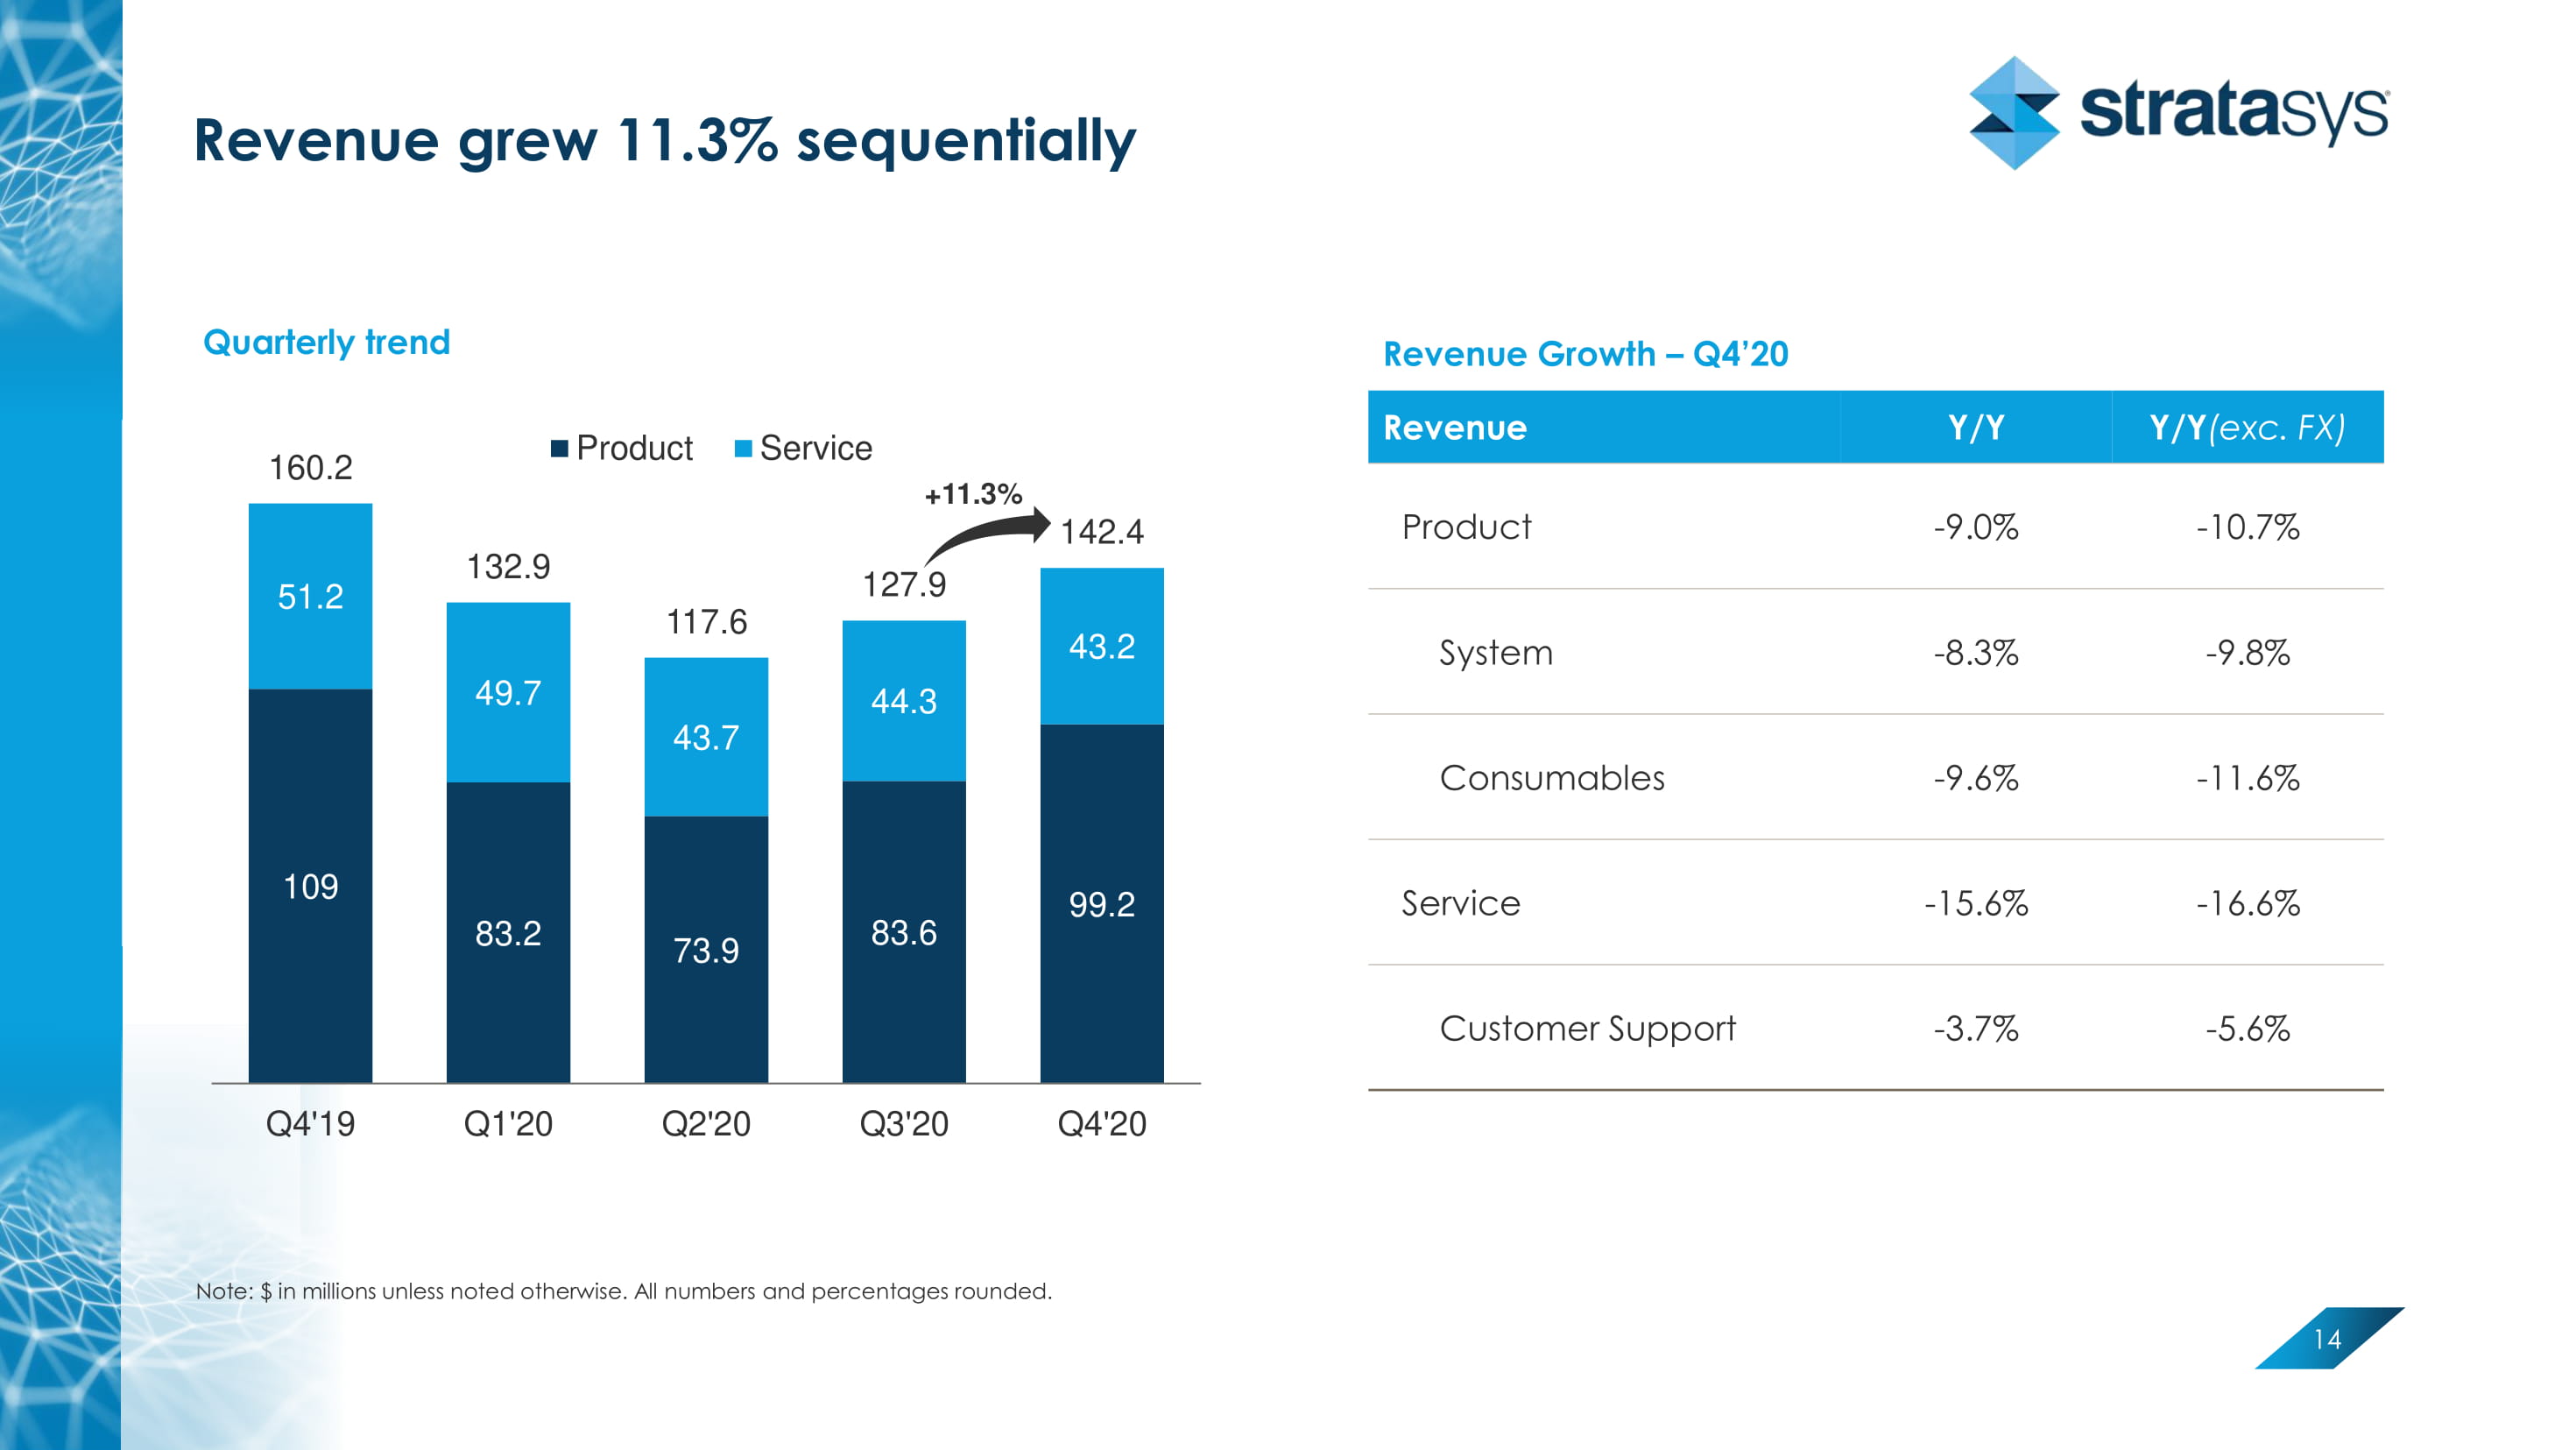
Revenue grew 11.3% sequentially 14 Note: $ in millions unless noted otherwise. All numbers and percentages rounded. Quarterly trend 109 83.2 73.9 83.6 99.2 51.2 49.7 43.7 44.3 43.2 160.2 132.9 117.6 127.9 142.4 Q4'19 Q1'20 Q2'20 Q3'20 Q4'20 Product Service Revenue Growth – Q4’20 Revenue Y/Y Y/Y (exc. FX) Product - 9.0% - 10.7% System - 8.3% - 9.8% Consumables - 9.6% - 11.6% Service - 15.6% - 16.6% Customer Support - 3.7% - 5.6% +11.3%
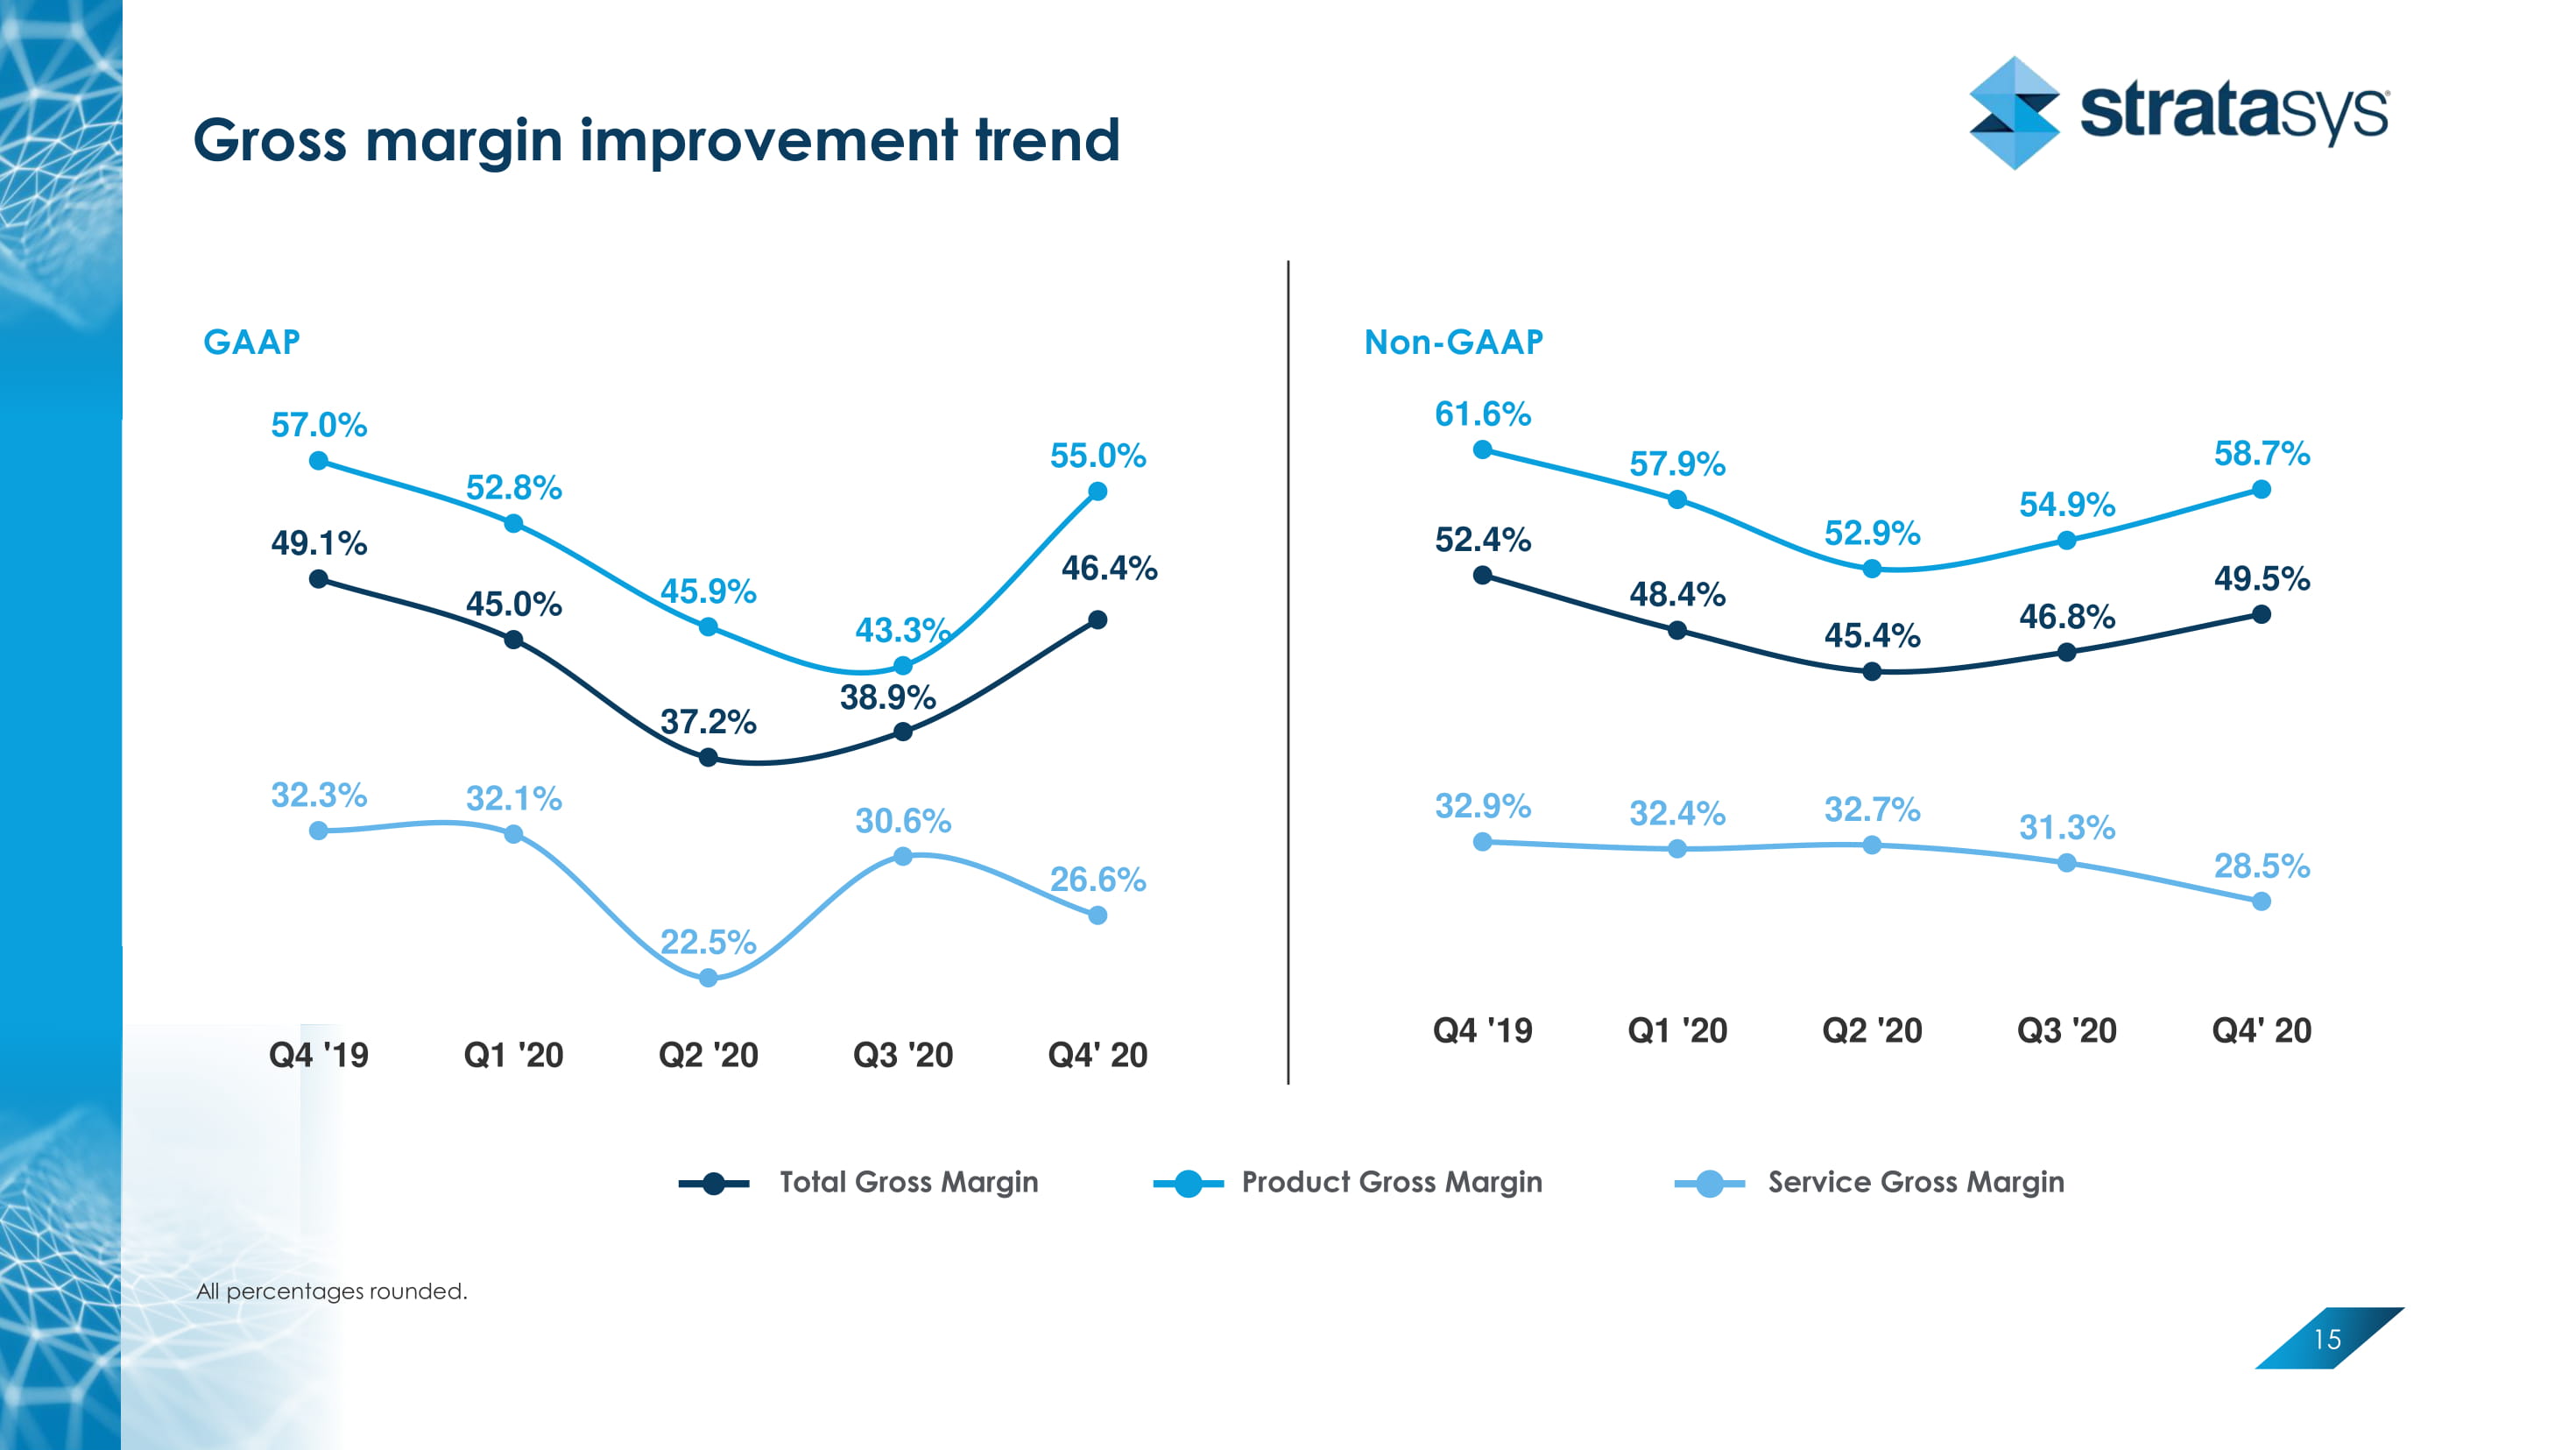
Gross margin improvement trend 15 All percentages rounded. GAAP Non - GAAP 49.1% 45.0% 37.2% 38.9% 46.4% 57.0% 52.8% 45.9% 43.3% 55.0% 32.3% 32.1% 22.5% 30.6% 26.6% Q4 '19 Q1 '20 Q2 '20 Q3 '20 Q4' 20 52.4% 48.4% 45.4% 46.8% 49.5% 61.6% 57.9% 52.9% 54.9% 58.7% 32.9% 32.4% 32.7% 31.3% 28.5% Q4 '19 Q1 '20 Q2 '20 Q3 '20 Q4' 20 Total Gross Margin Product Gross Margin Service Gross Margin
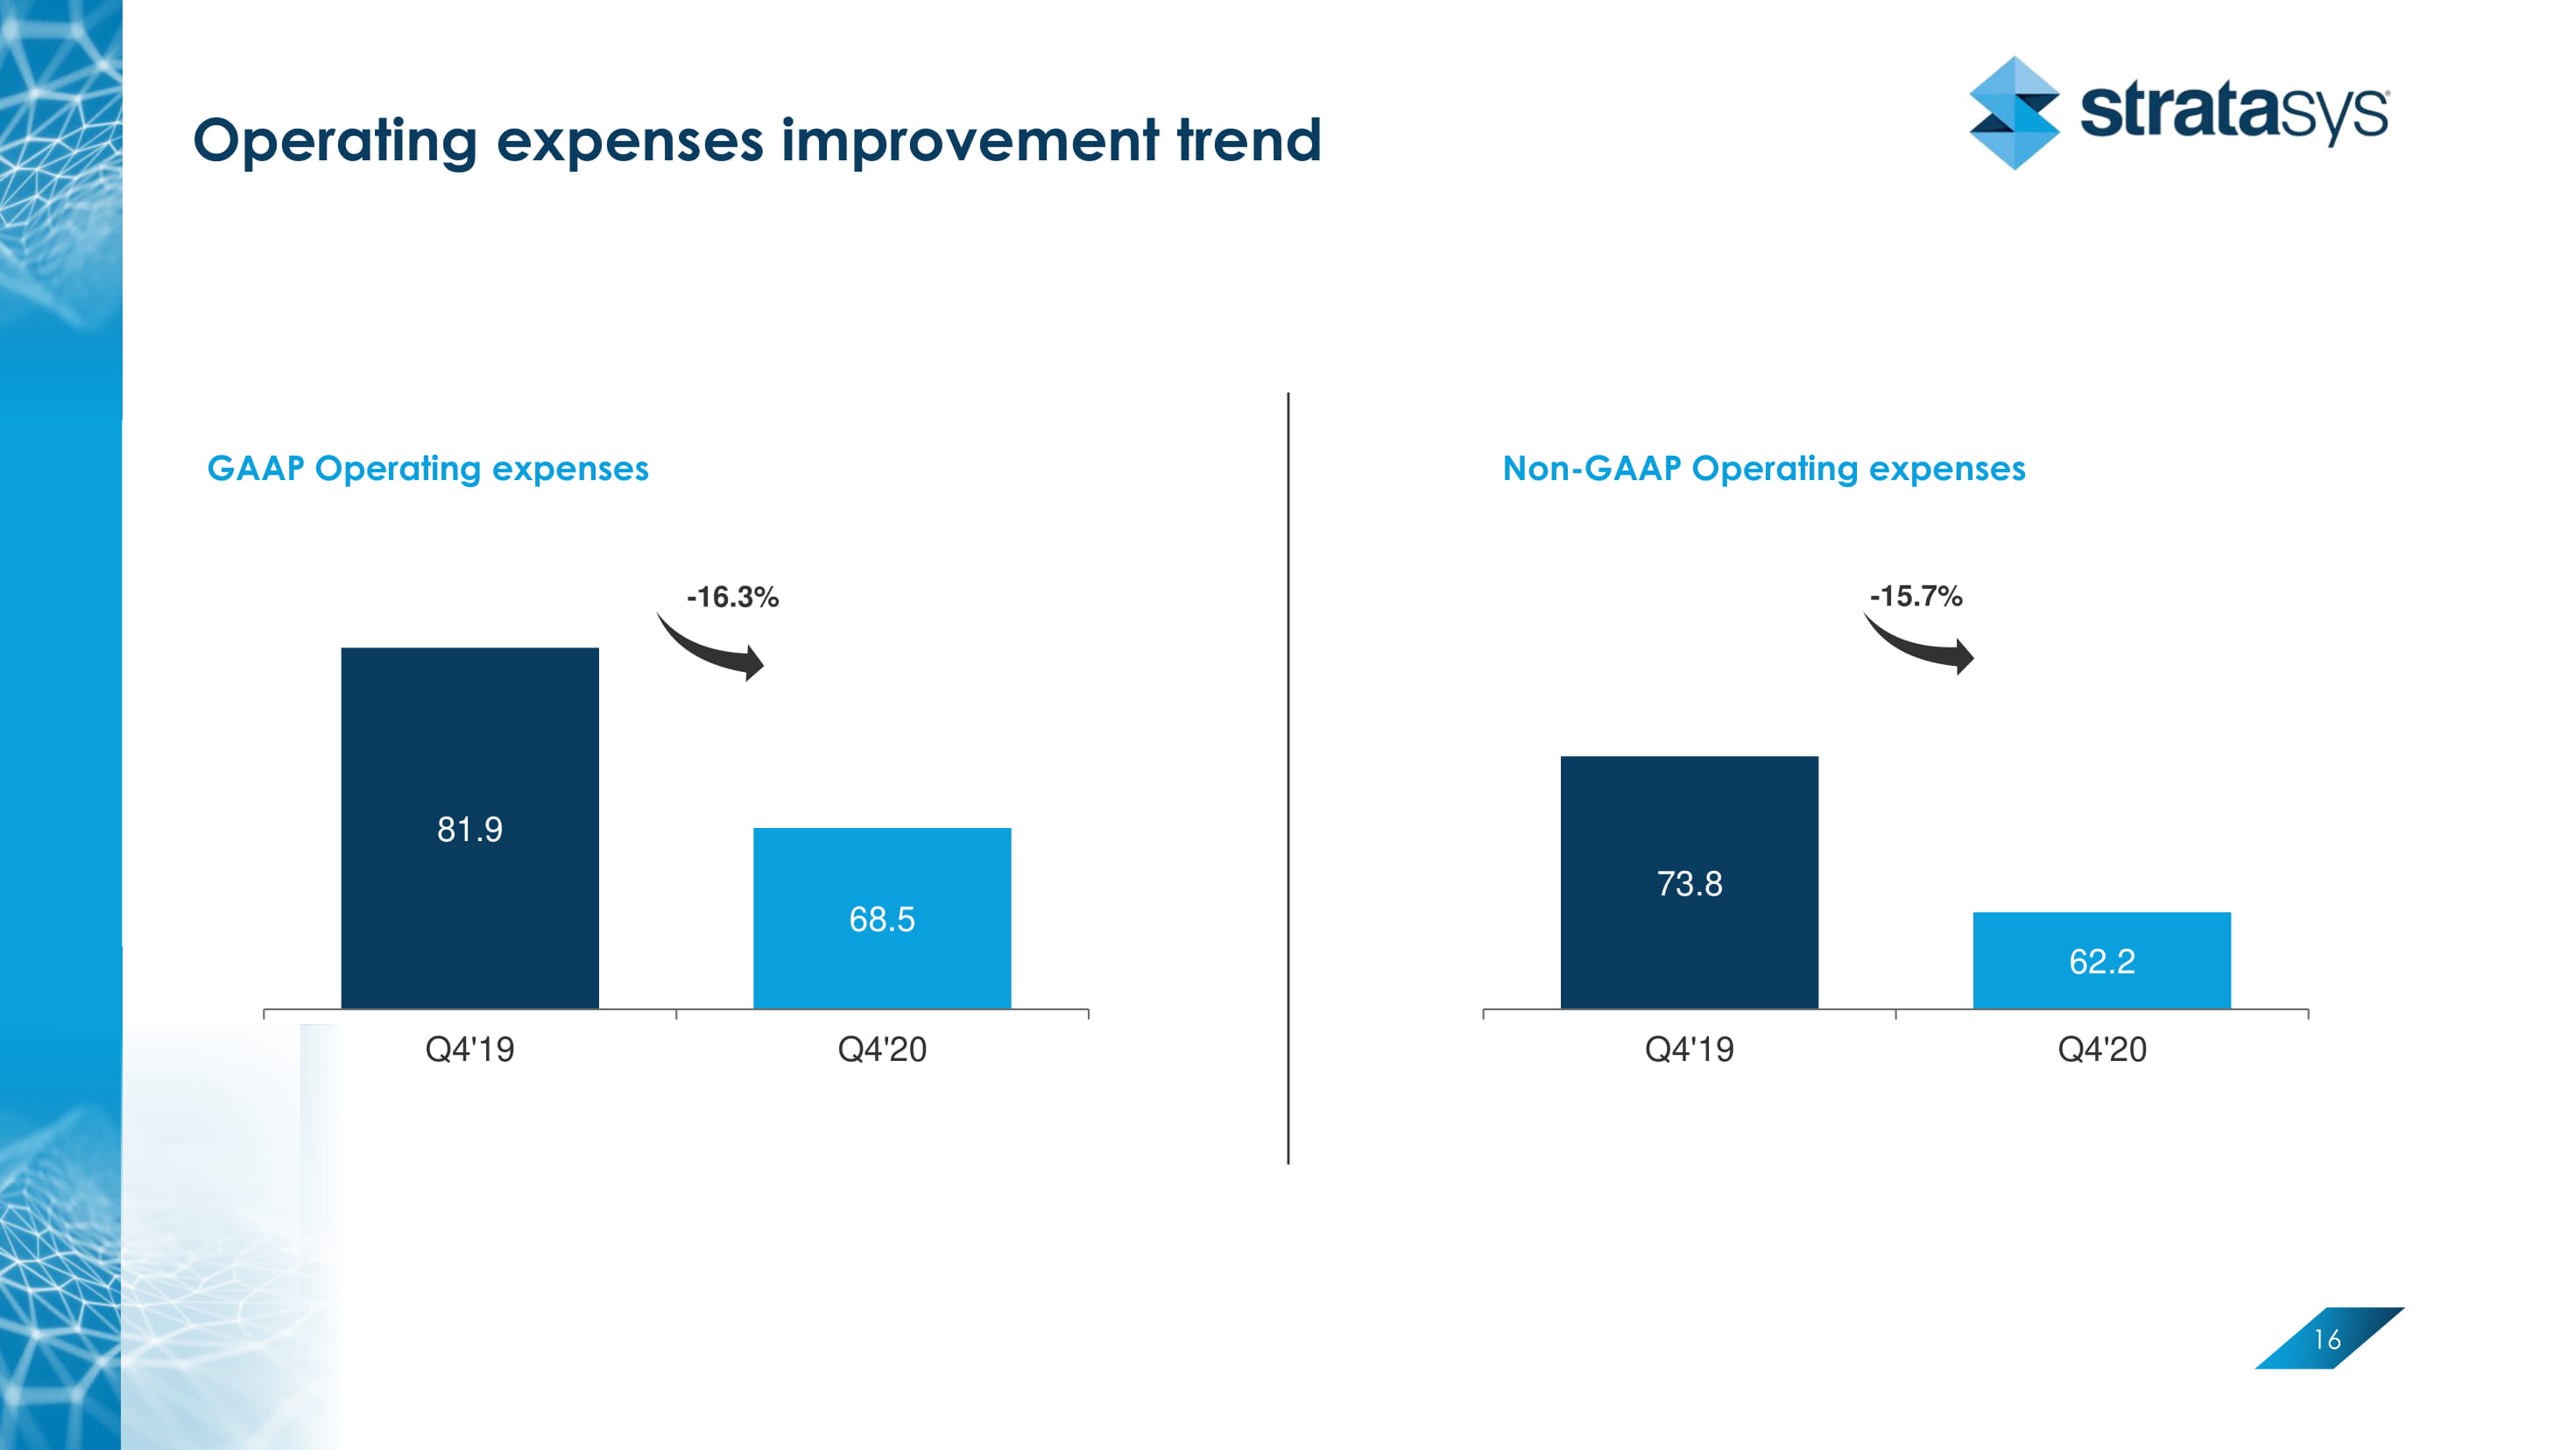
Operating expenses improvement trend 16 81.9 68.5 Q4'19 Q4'20 - 16.3% 73.8 62.2 Q4'19 Q4'20 Non - GAAP Operating expenses - 15.7% GAAP Operating expenses
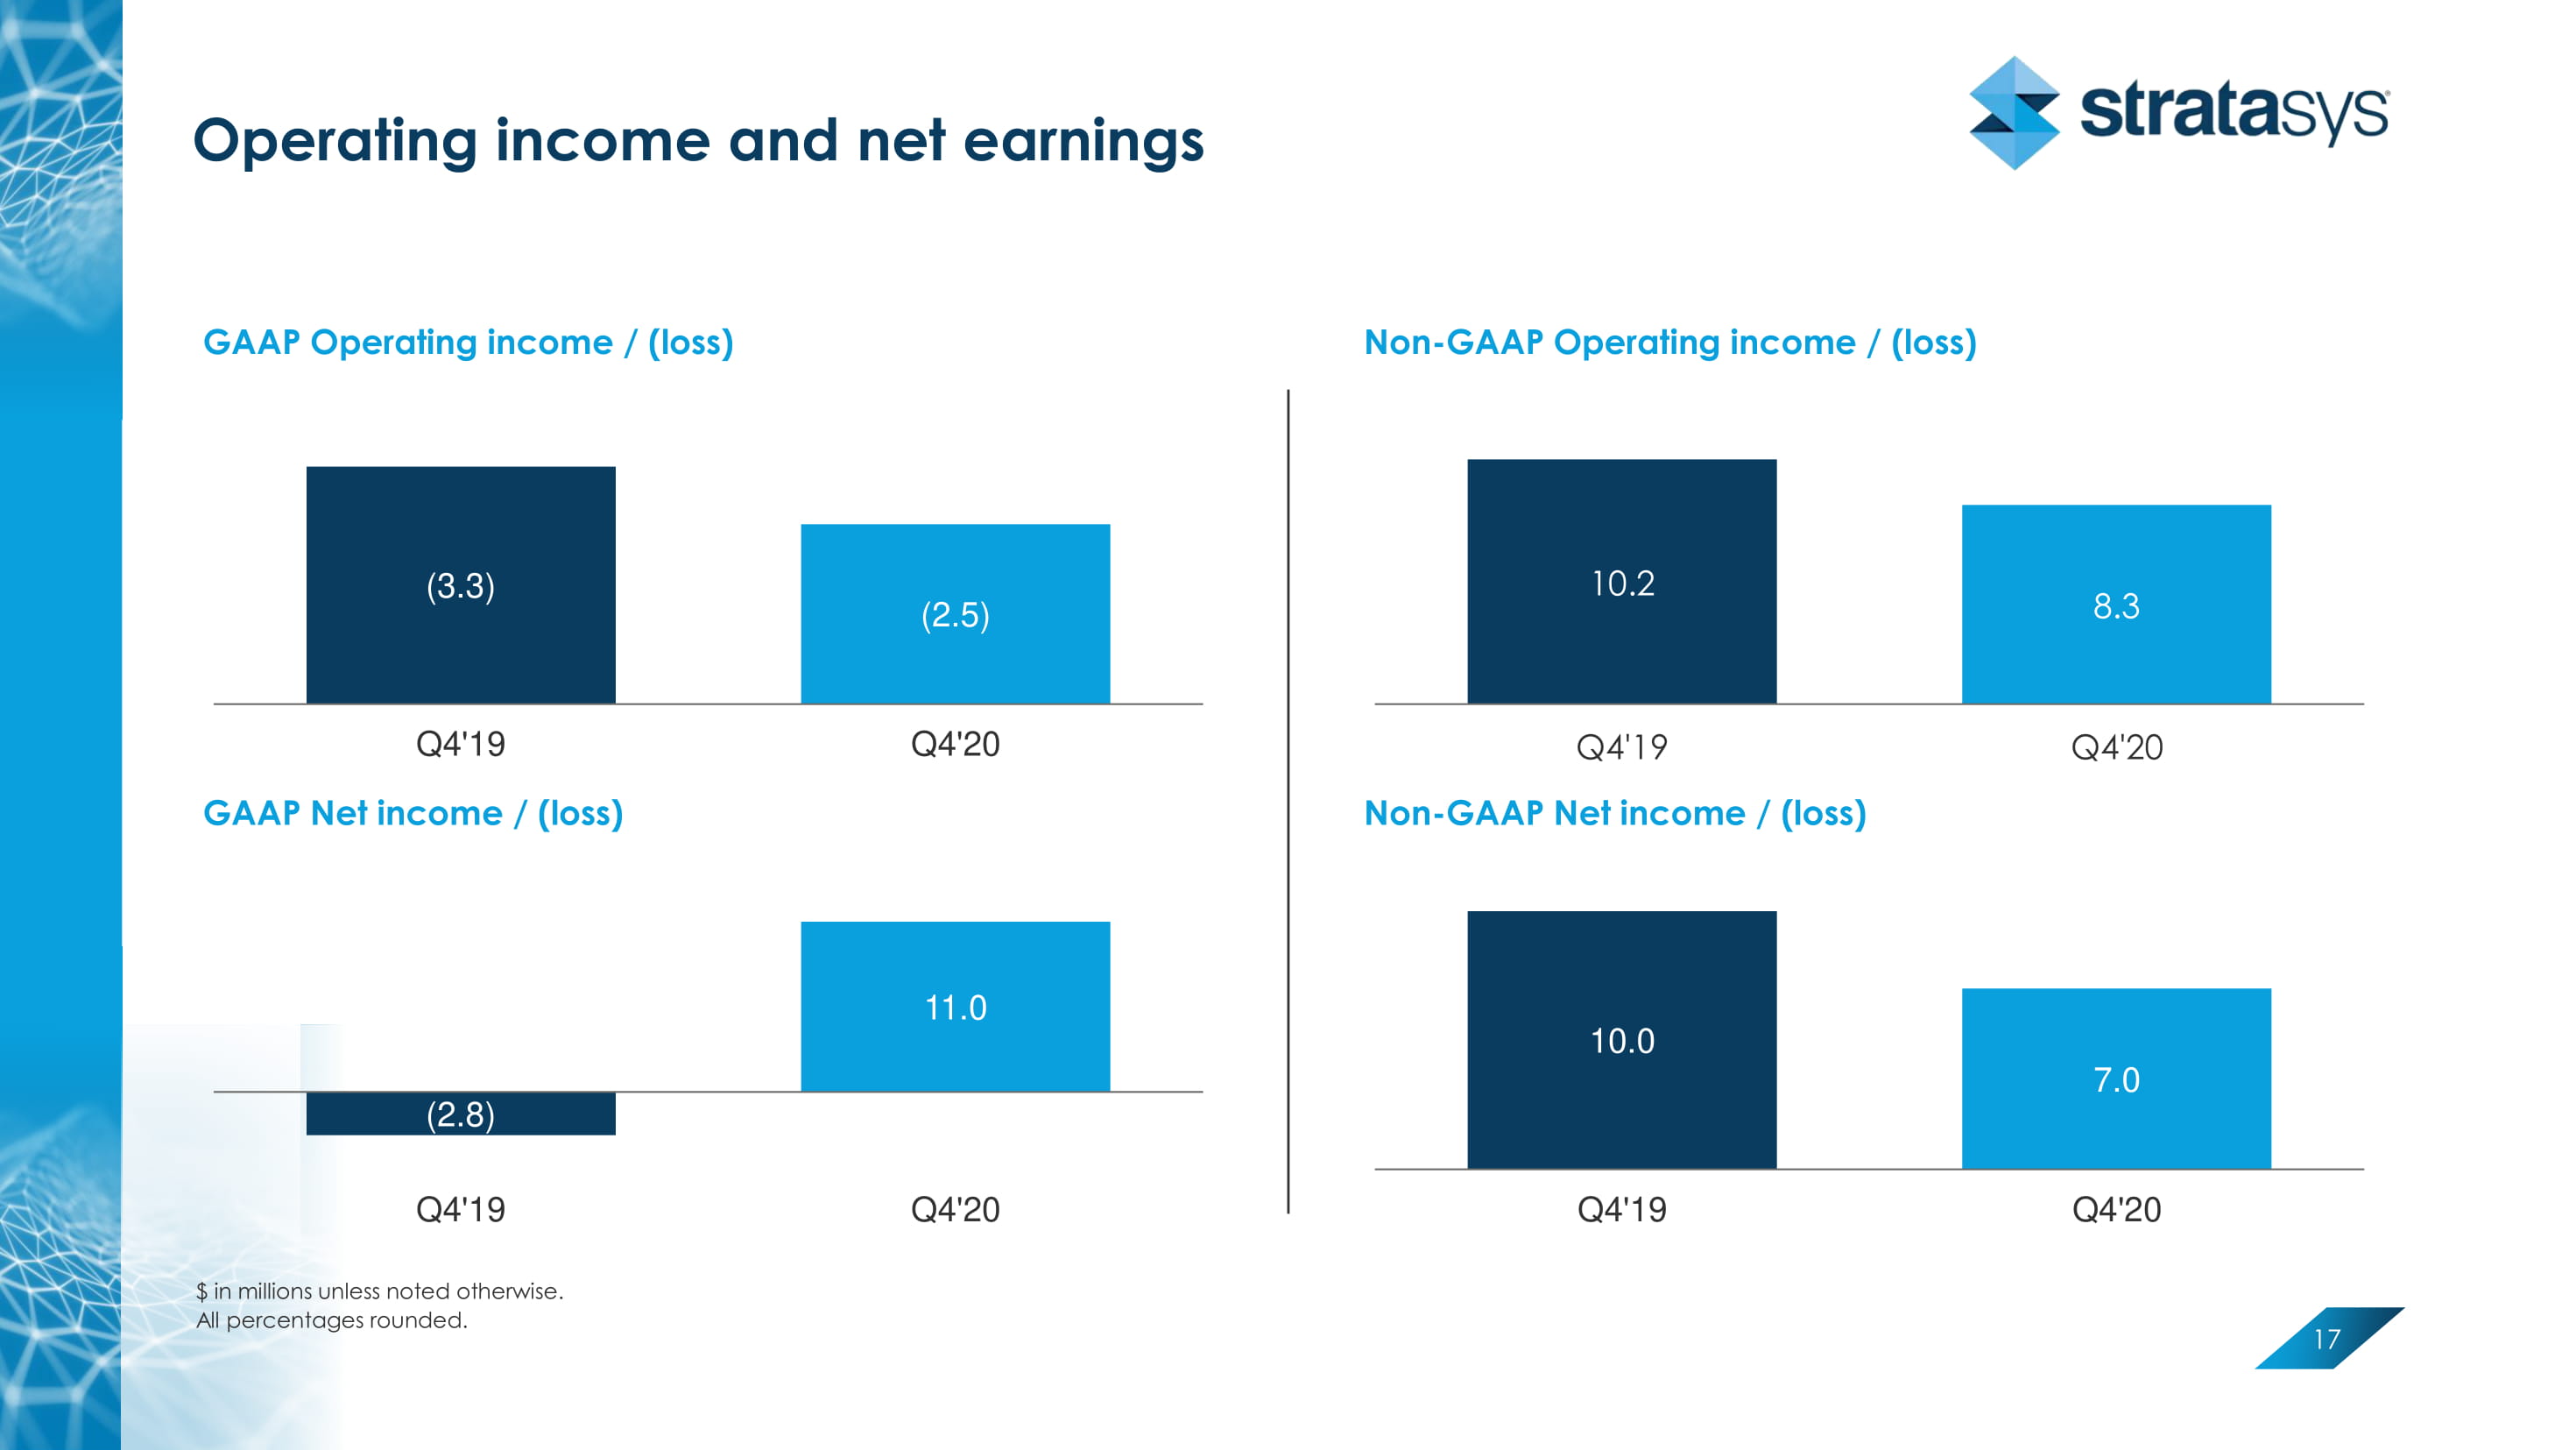
Operating income and net earnings 17 $ in millions unless noted otherwise. All percentages rounded. GAAP Operating income / (loss) Non - GAAP Operating income / (loss) (3.3) (2.5) Q4'19 Q4'20 10.2 8.3 Q4'19 Q4'20 GAAP Net income / (loss) Non - GAAP Net income / (loss) (2.8) 11.0 Q4'19 Q4'20 10.0 7.0 Q4'19 Q4'20
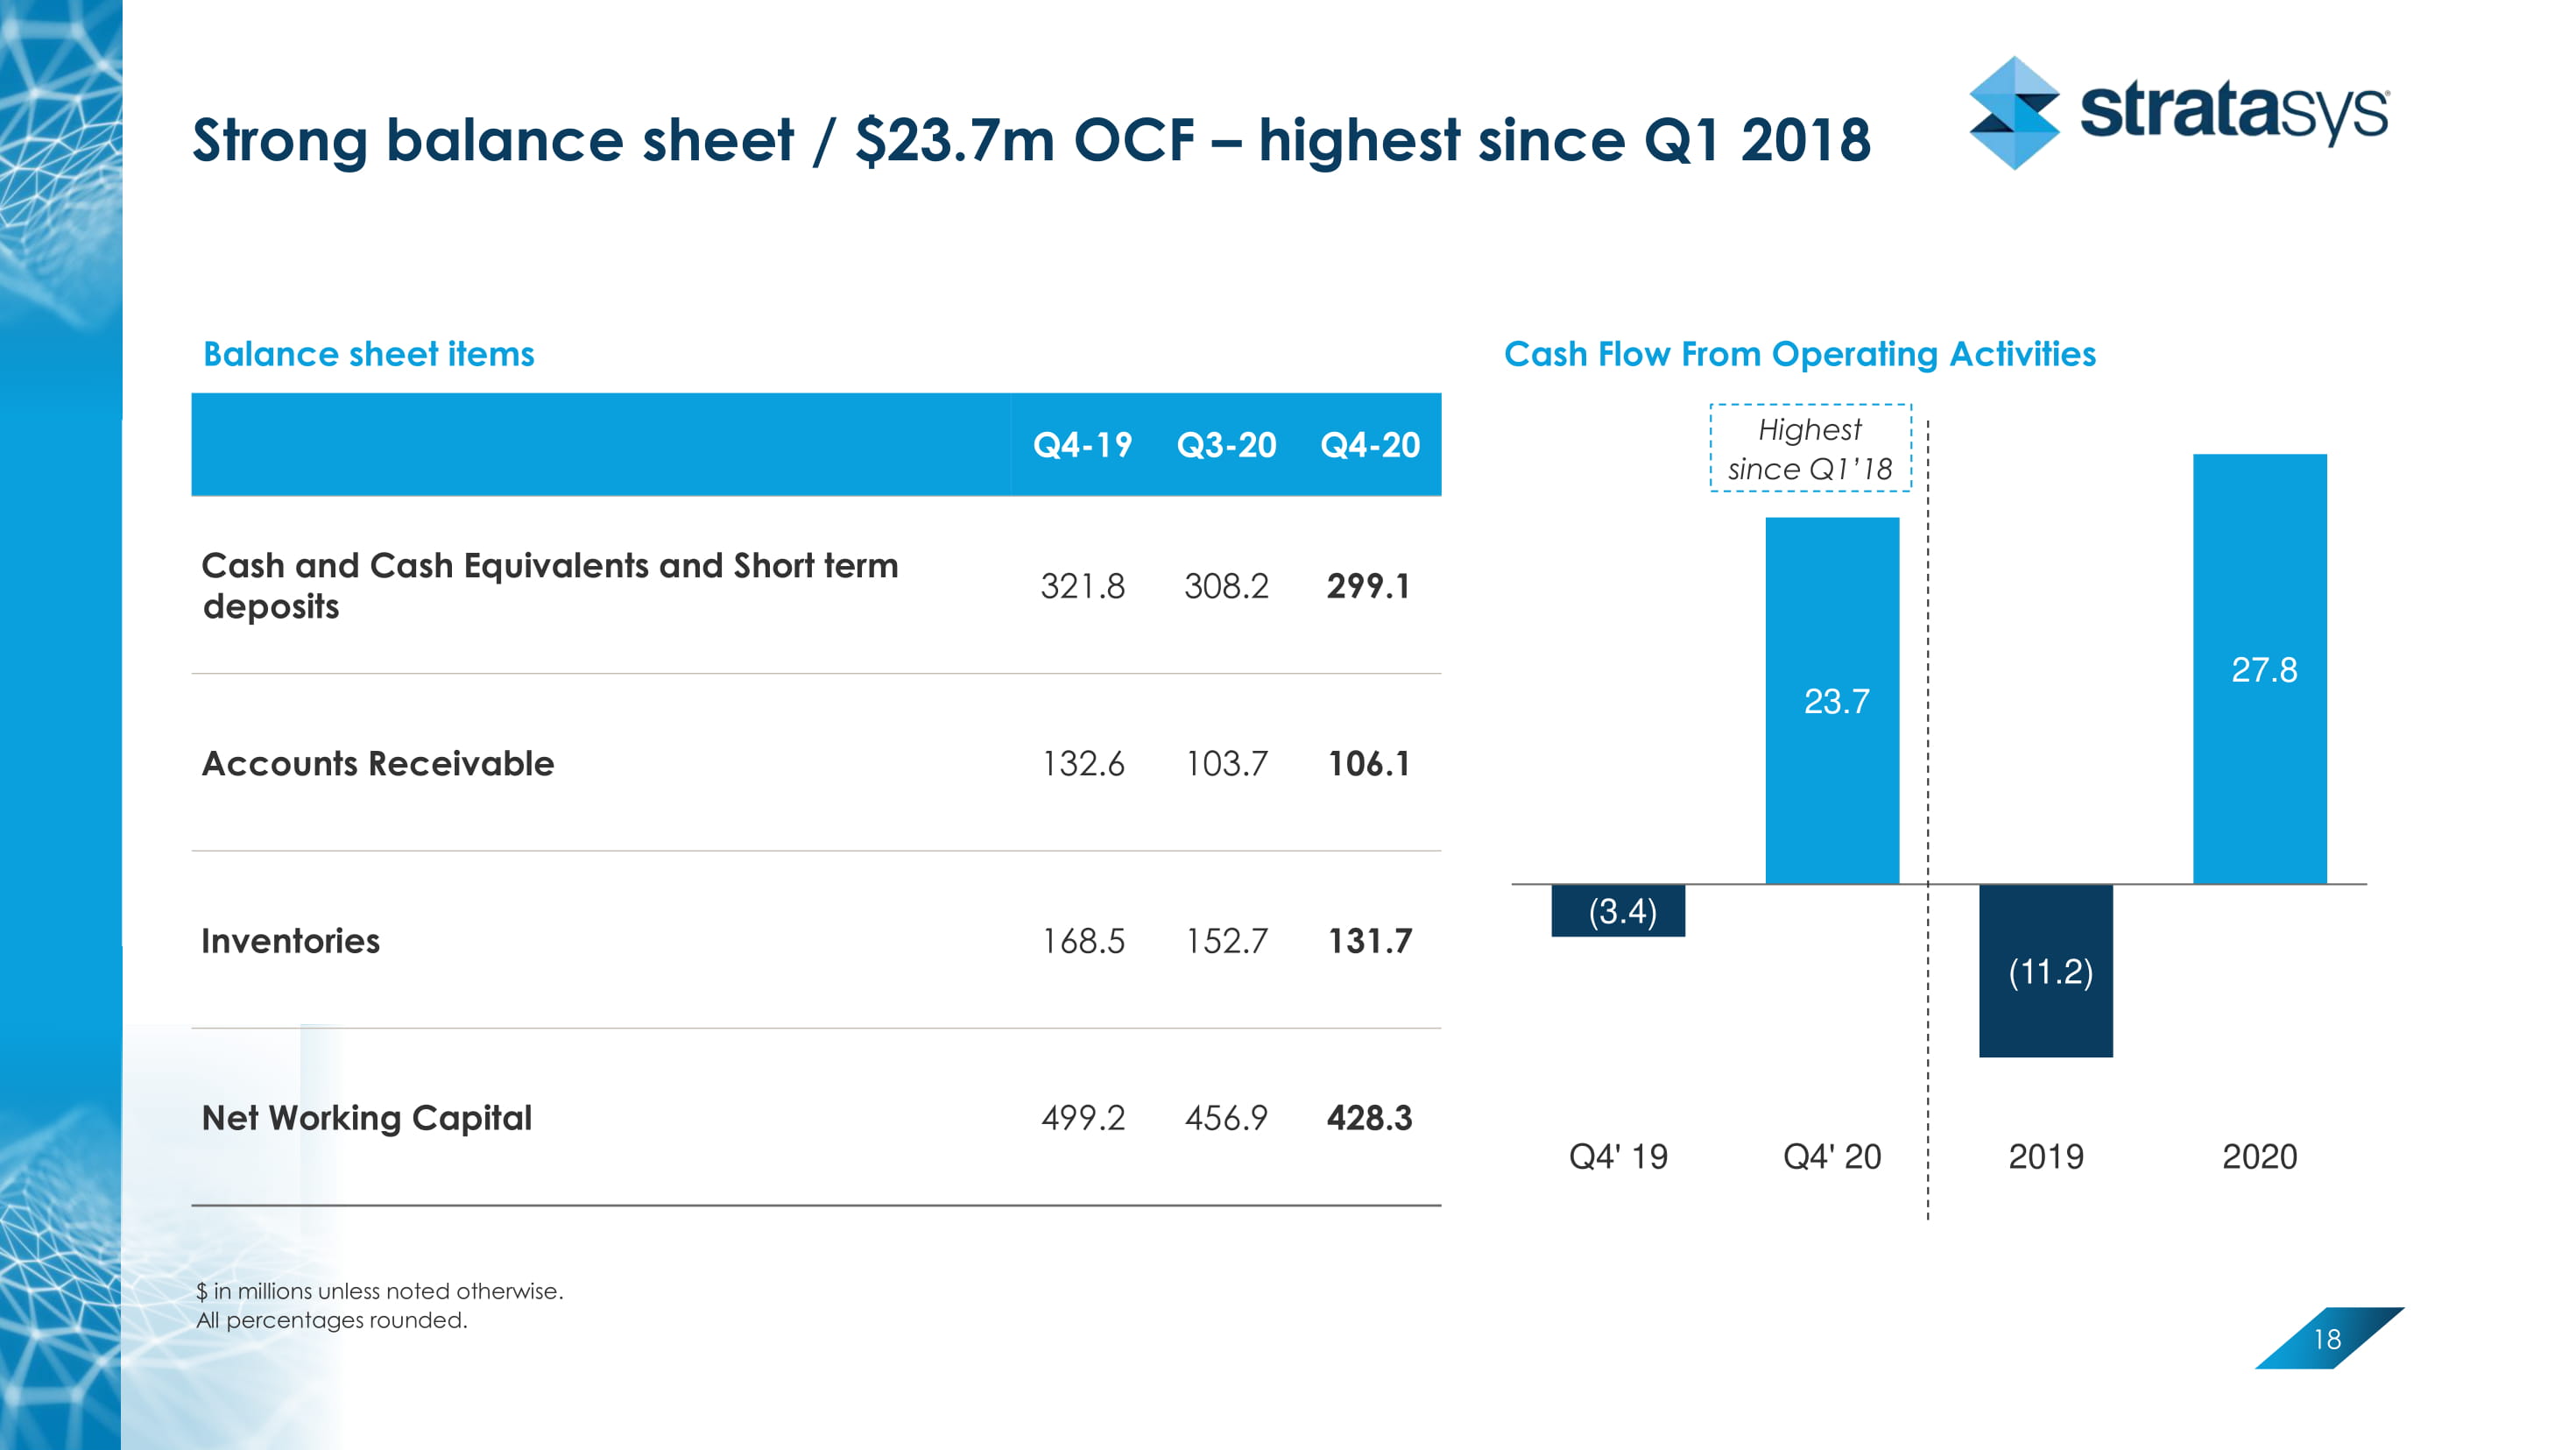
Strong balance sheet / $23.7m OCF – highest since Q1 2018 18 $ in millions unless noted otherwise. All percentages rounded. Balance sheet items Cash Flow From Operating Activities (3.4) 23.7 (11.2) 27.8 Q4' 19 Q4' 20 2019 2020 Q4 - 19 Q3 - 20 Q4 - 20 Cash and Cash Equivalents and Short term deposits 321.8 308.2 299.1 Accounts Receivable 132.6 103.7 106.1 Inventories 168.5 152.7 131.7 Net Working Capital 499.2 456.9 428.3 Highest since Q1’18
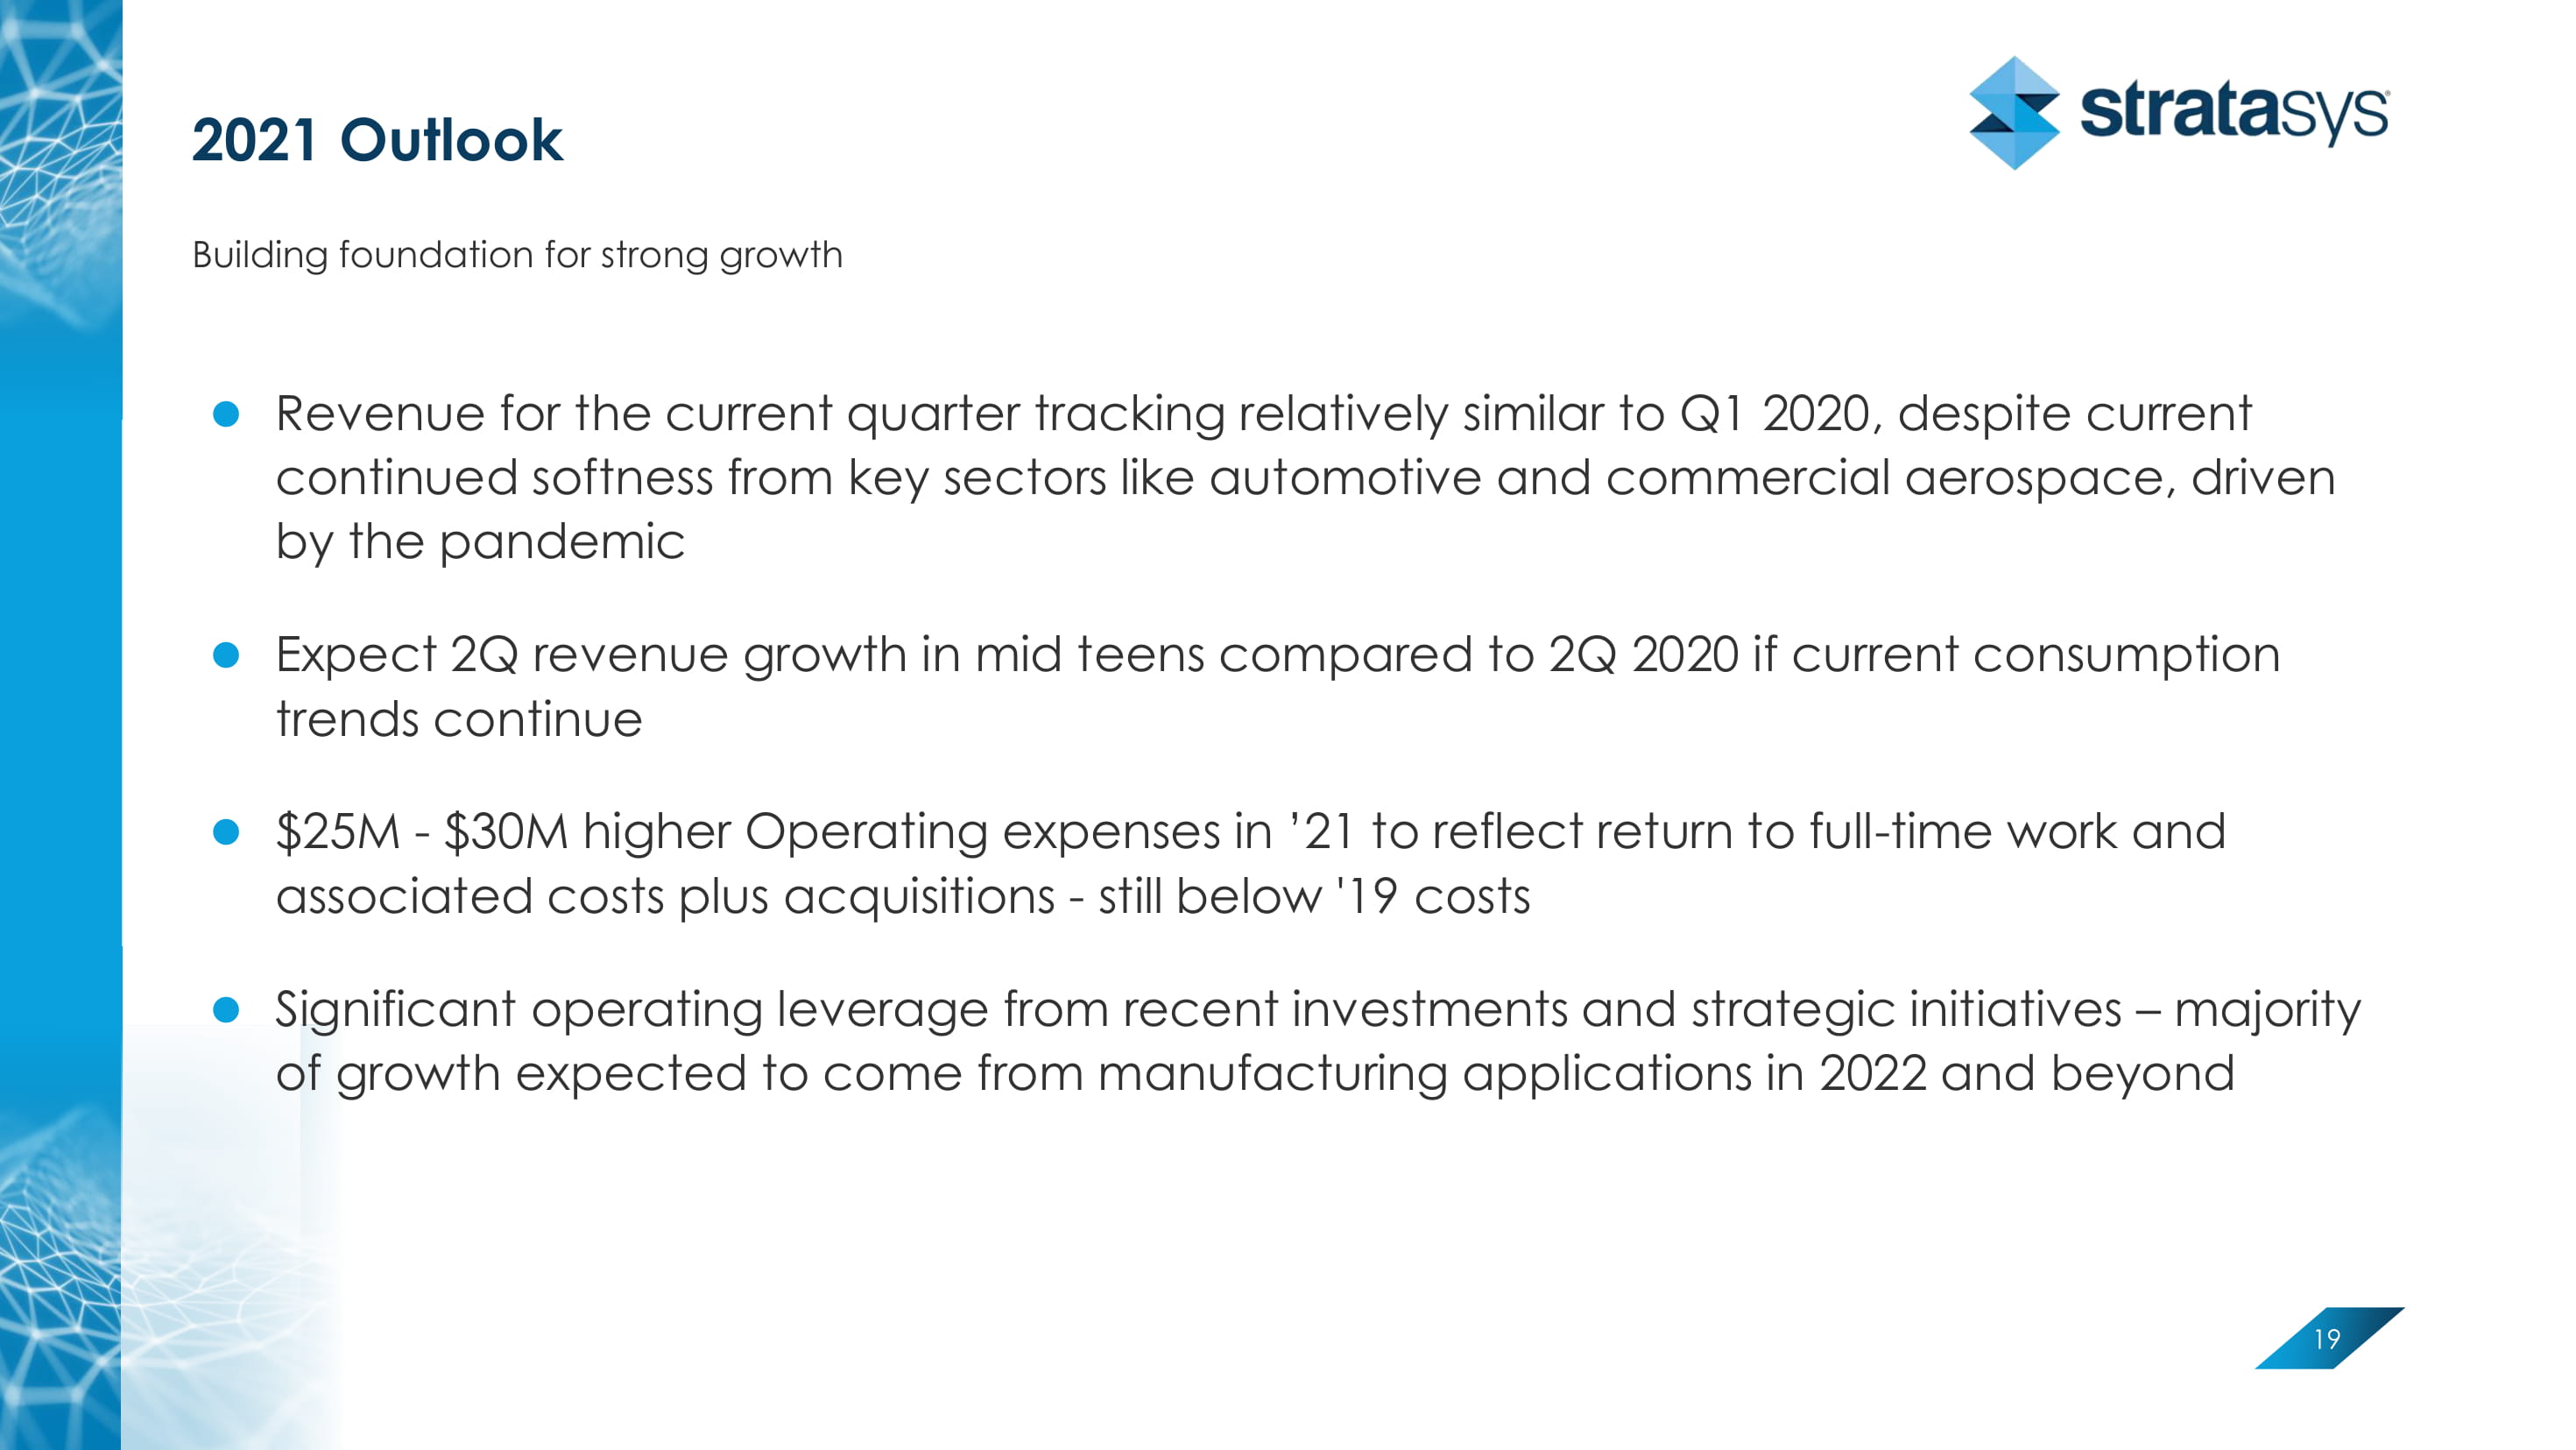
2021 Outlook 19 Building foundation for strong growth Revenue for the current quarter tracking relatively similar to Q1 2020 , despite current continued softness from key sectors like automotive and commercial aerospace, driven by the pandemic Expect 2Q revenue growth in mid teens compared to 2Q 2020 if current consumption trends continue $25M - $30M higher Operating expenses in ’21 to reflect return to full - time work and associated costs plus acquisitions - still below '19 costs Significant operating leverage from recent investments and strategic initiatives – majority of growth expected to come from manufacturing applications in 2022 and beyond
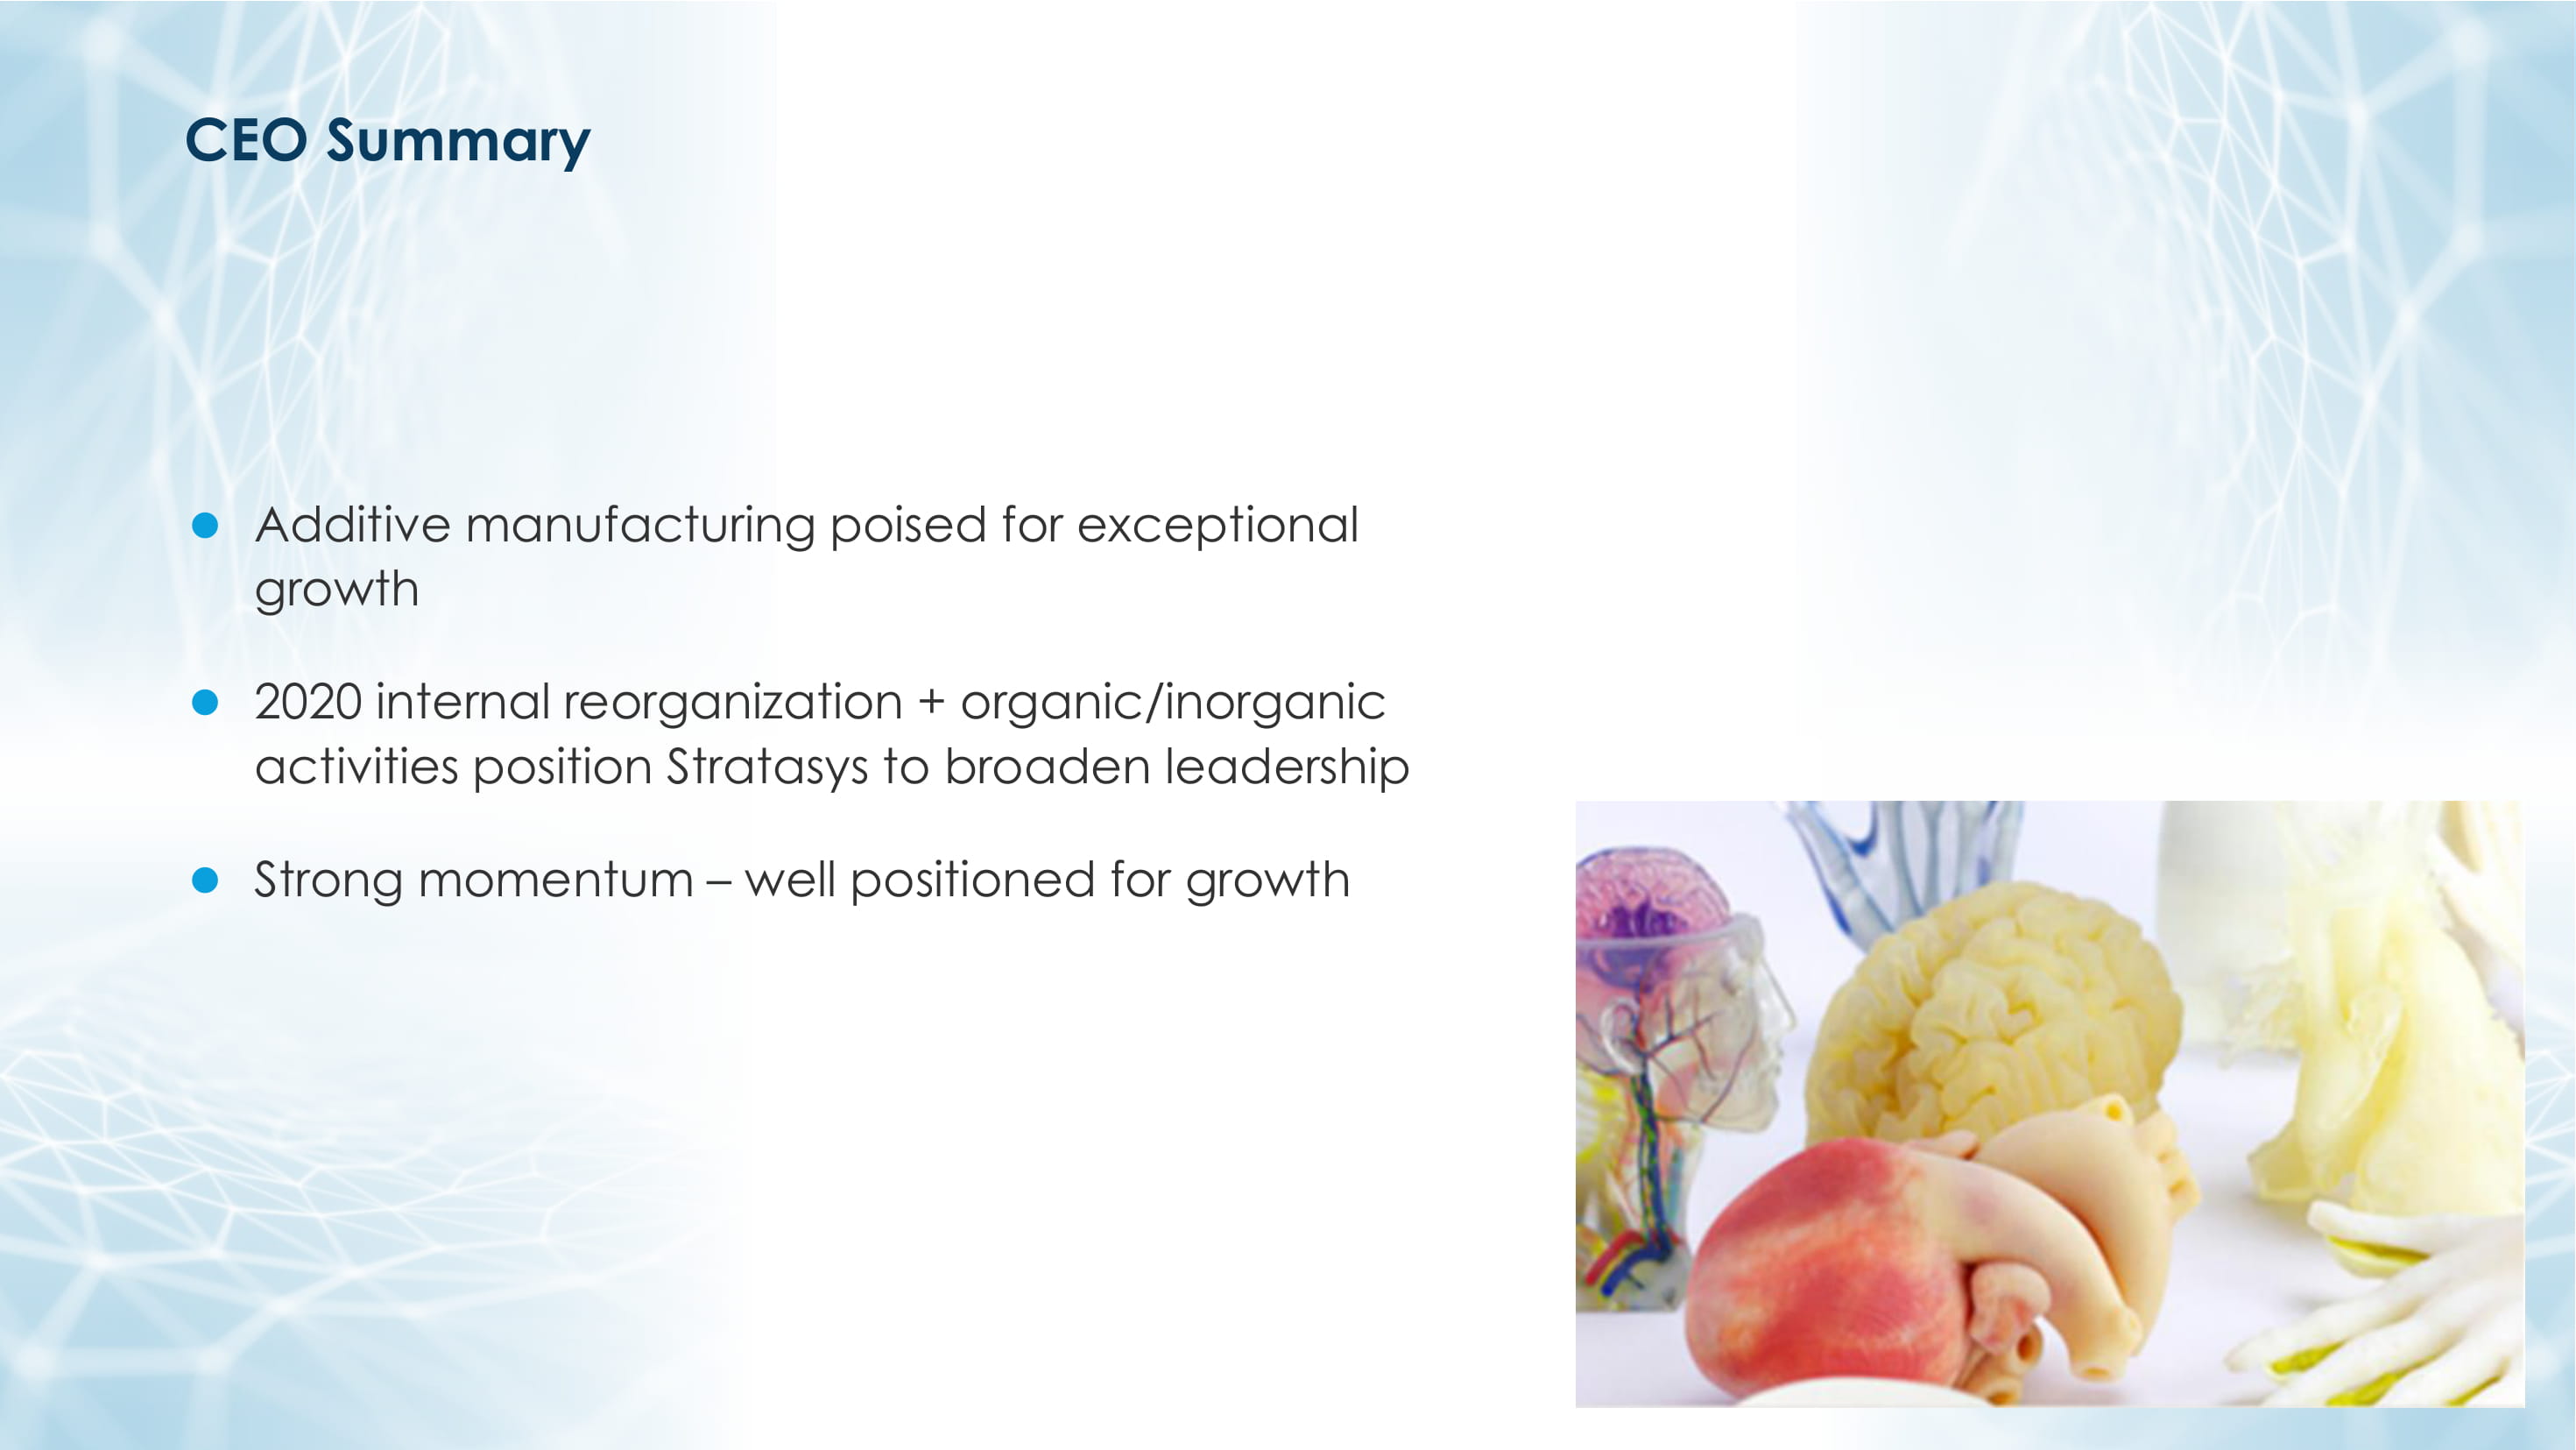
CEO Summary Additive manufacturing poised for exceptional growth 2020 internal reorganization + organic/inorganic activities position Stratasys to broaden leadership Strong momentum – well positioned for growth

Thank You: Q&A

Appendix
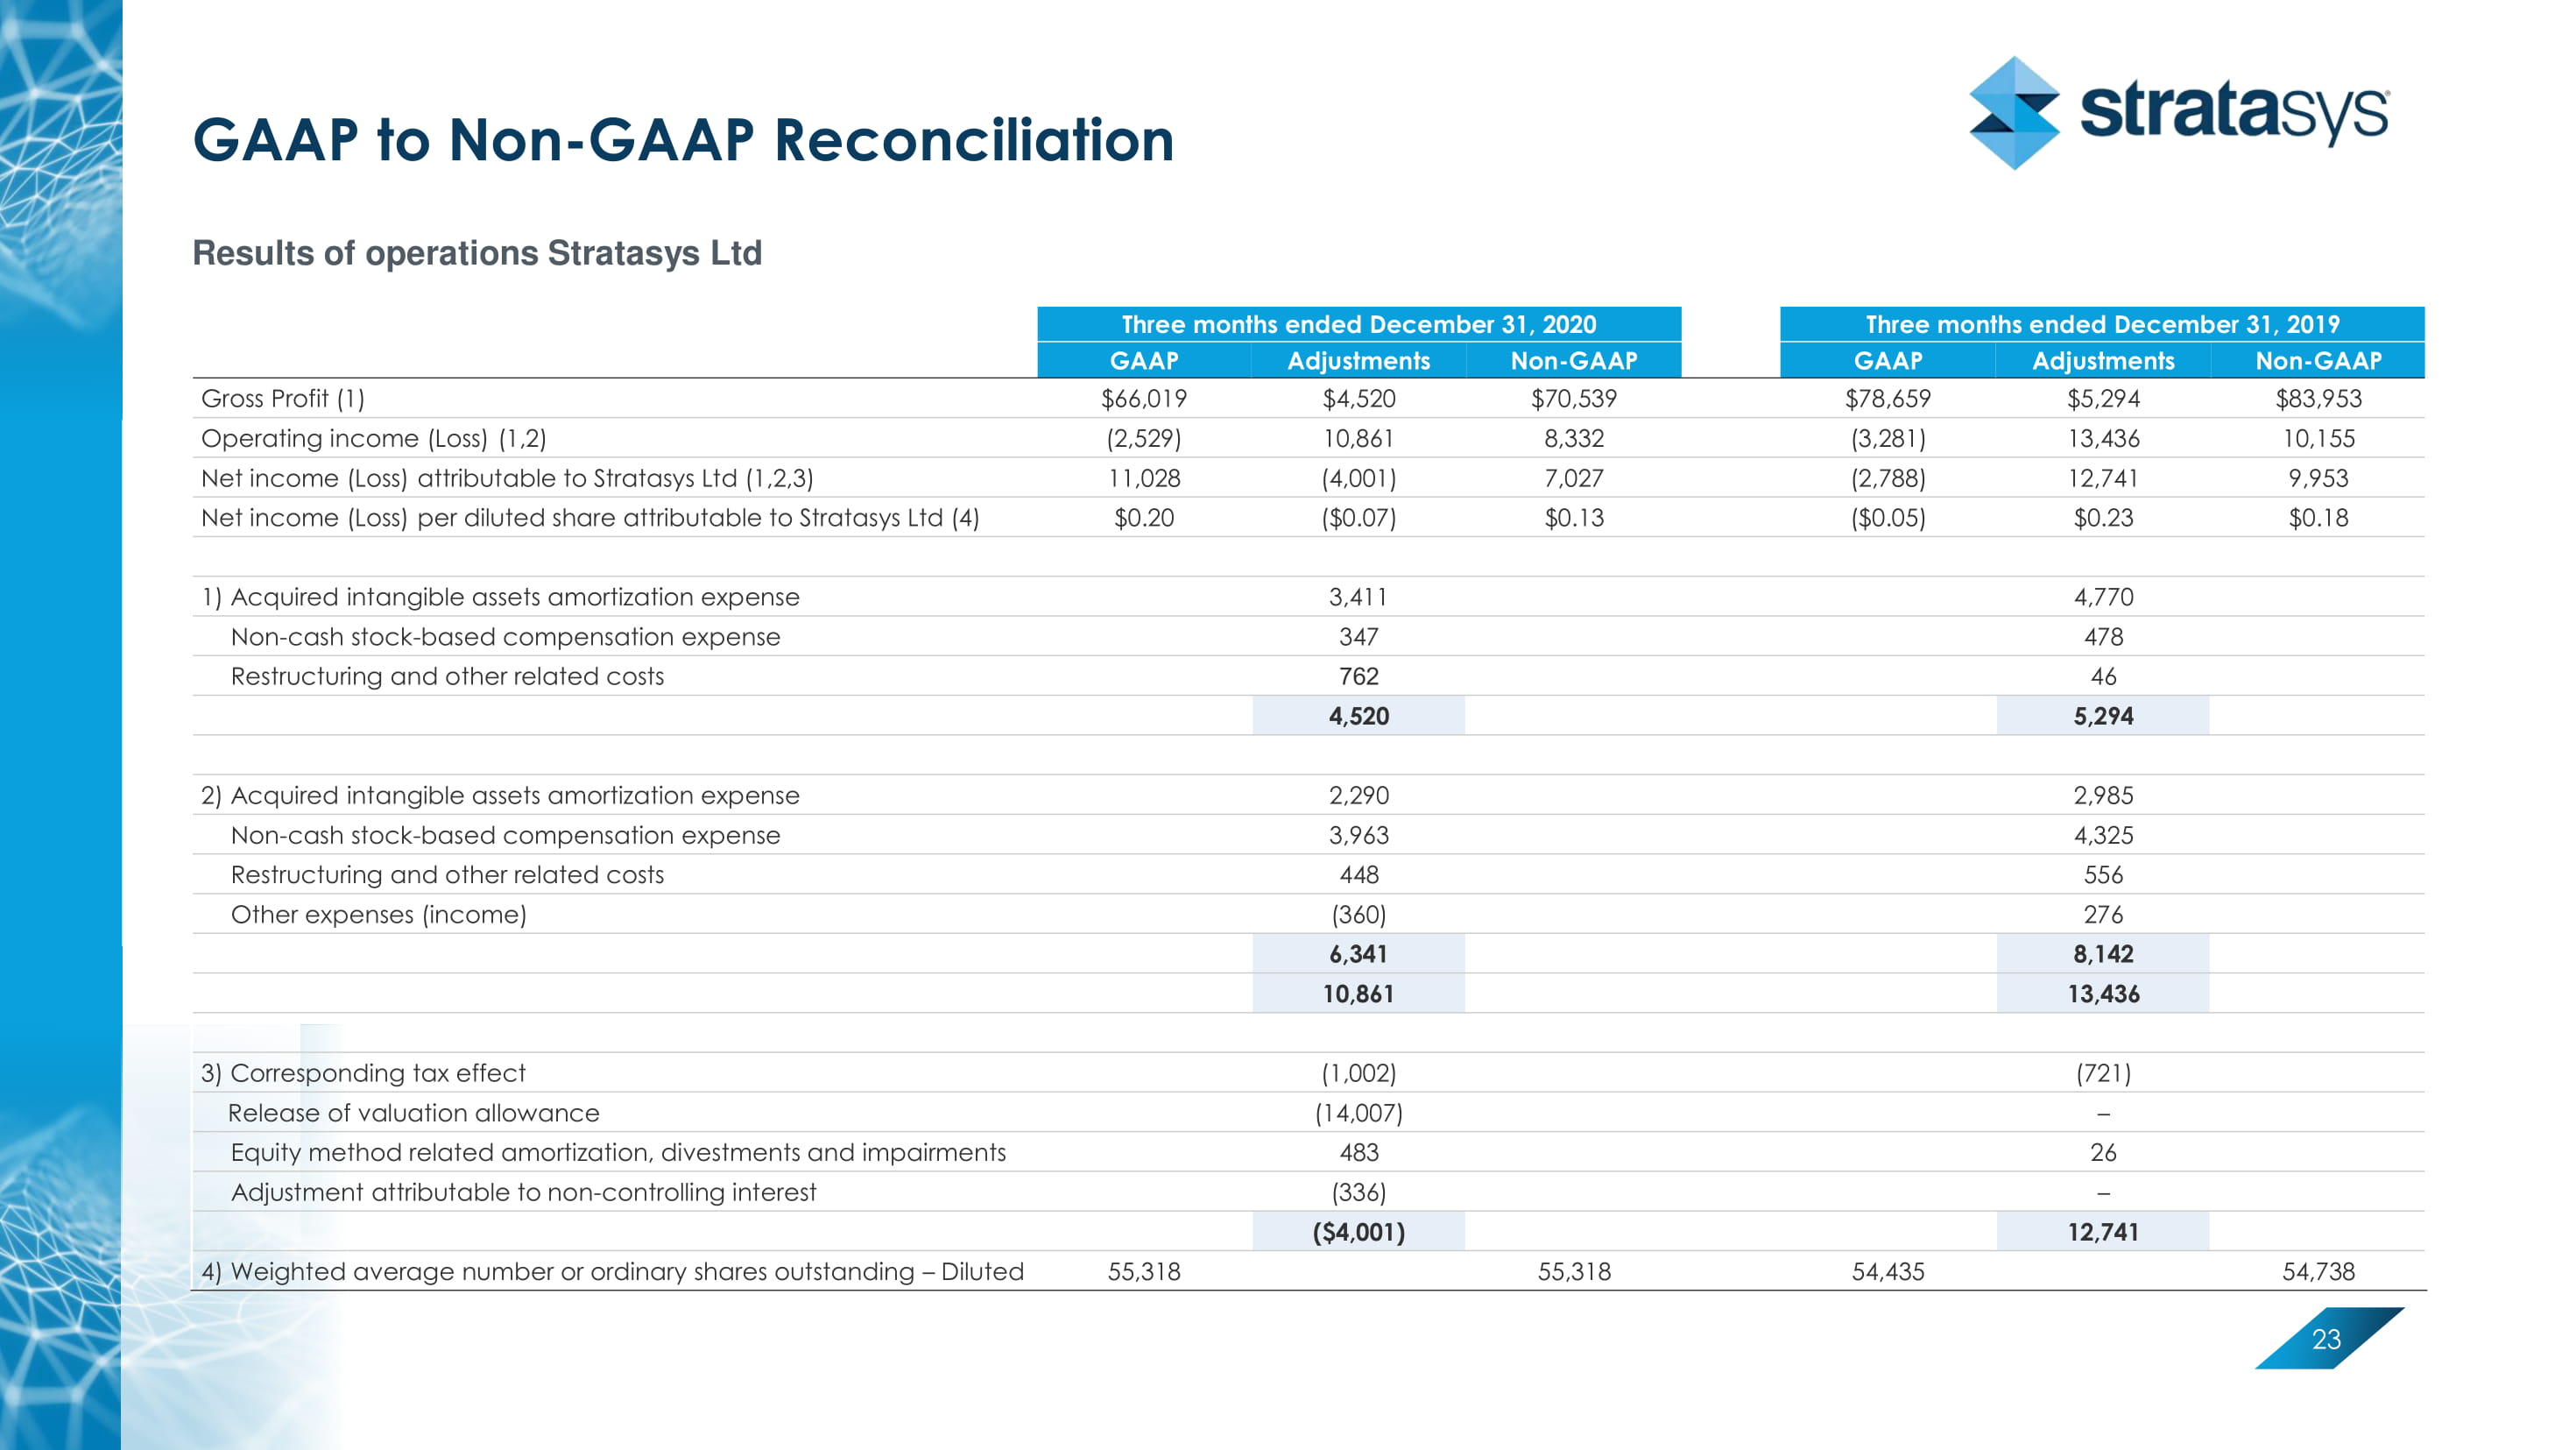
GAAP to Non - GAAP Reconciliation 23 Results of operations Stratasys Ltd Three months ended December 31, 2020 Three months ended December 31, 2019 GAAP Adjustments Non - GAAP GAAP Adjustments Non - GAAP Gross Profit (1) $66,019 $4,520 $70,539 $78,659 $5,294 $83,953 Operating income (Loss) (1,2) (2,529) 10,861 8,332 (3,281) 13,436 10,155 Net income (Loss) attributable to Stratasys Ltd (1,2,3) 11,028 (4,001) 7,027 (2,788) 12,741 9,953 Net income (Loss) per diluted share attributable to Stratasys Ltd (4) $0.20 ($0.07) $0.13 ($0.05) $0.23 $0.18 1) Acquired intangible assets amortization expense 3,411 4,770 Non - cash stock - based compensation expense 347 478 Restructuring and other related costs 46 4,520 5,294 2) Acquired intangible assets amortization expense 2,290 2,985 Non - cash stock - based compensation expense 3,963 4,325 Restructuring and other related costs 448 556 Other expenses (income) (360) 276 6,341 8,142 10,861 13,436 3) Corresponding tax effect (1,002) (721) Release of valuation allowance (14,007) - Equity method related amortization, divestments and impairments 483 26 Adjustment attributable to non - controlling interest (336) - ($4,001) 12,741 4) Weighted average number or ordinary shares outstanding - Diluted 55,318 55,318 54,435 54,738