Exhibit 99.3
STRATASYS Q3 2015 November 4th, 2015 FINANCIAL RESULTS CONFERENCE CALL
Exhibit 99.3
STRATASYS Q3 2015 November 4th, 2015 FINANCIAL RESULTS CONFERENCE CALL

Q3 2015 Conference and webcast details Live Dial-in Information Primary Dial-in: 866-270-6057 International Dial-in: 617-213-8891 Participant Passcode: 66906702 Live webcast and replay: http://edge.media-server.com/m/p/svoedx39 Speakers David Reis CEO Erez Simha COO & CFO Shane Glenn VP, Investor Relations
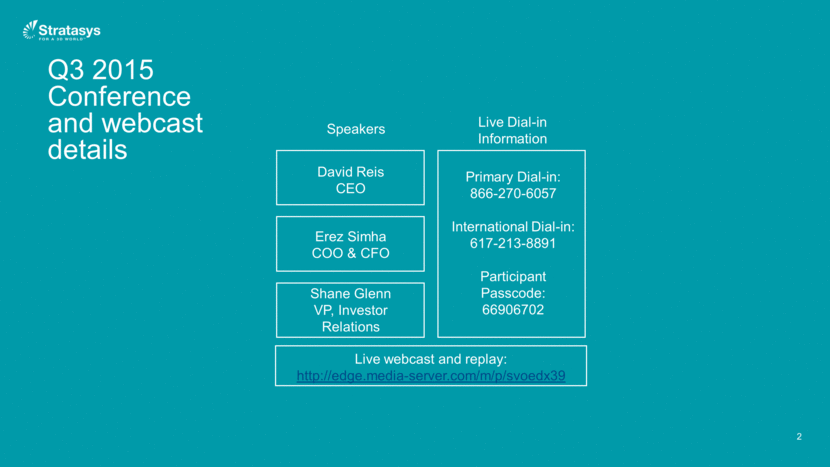
Certain statements in this press release are “forward-looking statements” within the meaning of the Private Securities Litigation Reform Act of 1995, Section 27A of the Securities Act of 1933, and Section 21E of the Securities Exchange Act of 1934. Forward-looking statements are characterized by the use of forward-looking terminology such as “will,” “expects,” “anticipates,” “continues,” “believes,” “should,” “intended,” “projected,” “guidance,” “preliminary,” “future,” “planned,” “committed,” and other similar words. These forward-looking statements include, but are not limited to, statements relating to the Company’s objectives, plans and strategies, statements of preliminary or projected results of operations or of financial condition and all statements that address activities, events or developments that the Company intends, expects, projects, believes or anticipates will or may occur in the future. Forward-looking statements are not guarantees of future performance and are subject to risks and uncertainties. The Company has based these forward-looking statements on assumptions and assessments made by its management in light of their experience and their perception of historical trends, current conditions, expected future developments and other factors they believe to be appropriate. Important factors that could cause actual results, developments and business decisions to differ materially from those anticipated in these forward-looking statements include, among other things: the Company’s ability to efficiently and successfully integrate the operations of its acquired subsidiaries; the overall global economic environment; the impact of competition and new technologies; general market, political and economic conditions in the countries in which the Company operates; projected capital expenditures and liquidity; changes in the Company’s strategy; government regulations and approvals; changes in customers’ budgeting priorities; litigation and regulatory proceedings; and those factors referred to under “Risk Factors”, “Information on the Company”, “Operating and Financial Review and Prospects”, and generally in the Company’s annual report on Form 20-F for the year ended December 31, 2014, filed with the U.S. Securities and Exchange Commission (the “SEC”), and in other reports that the Company has filed with or furnished to the SEC from time to time. Readers are urged to carefully review and consider the various disclosures made in the Company’s SEC reports, which are designed to advise investors as to the risks and other factors that may affect its business, financial condition, results of operations and prospects. Any guidance and other forward-looking statements in this press release are made as of the date hereof, and the Company undertakes no obligation to publicly update or revise any forward-looking statements, whether as a result of new information, future events or otherwise, except as required by law. Forward Looking Statement
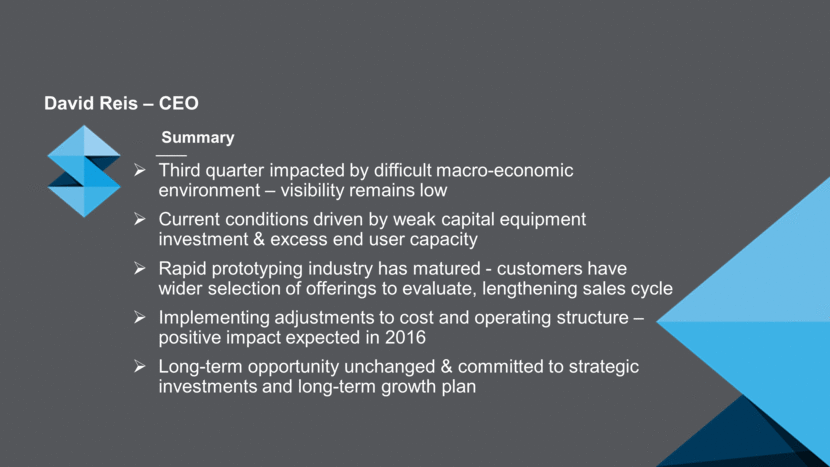
Summary Third quarter impacted by difficult macro-economic environment – visibility remains low Current conditions driven by weak capital equipment investment & excess end user capacity Rapid prototyping industry has matured - customers have wider selection of offerings to evaluate, lengthening sales cycle Implementing adjustments to cost and operating structure – positive impact expected in 2016 Long-term opportunity unchanged & committed to strategic investments and long-term growth plan David Reis – CEO
Financial Update and Guidance Erez Simha – CFO and COO Shane Glenn – VP of Investor Relations

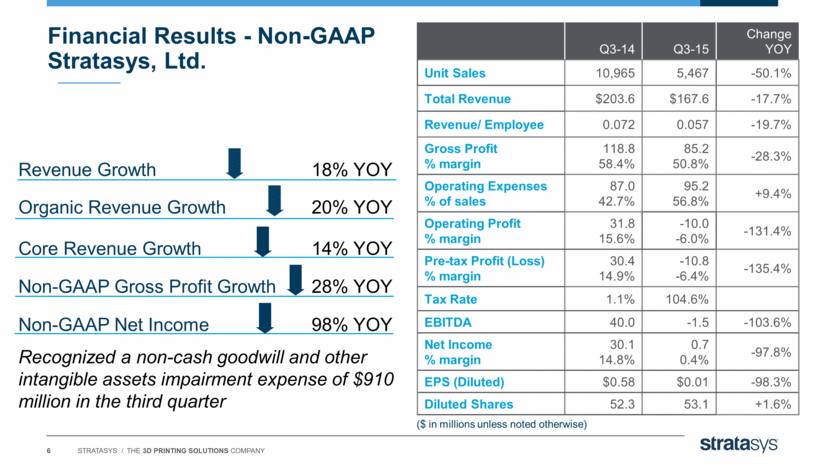
Financial Results - Non-GAAP Stratasys, Ltd. ($ in millions unless noted otherwise) Revenue Growth 18% YOY Organic Revenue Growth 20% YOY Non-GAAP Gross Profit Growth 28% YOY Non-GAAP Net Income 98% YOY Core Revenue Growth 14% YOY Q3-14 Q3-15 Change YOY Unit Sales 10,965 5,467 -50.1% Total Revenue $203.6 $167.6 -17.7% Revenue/ Employee 0.072 0.057 -19.7% Gross Profit % margin 118.8 58.4% 85.2 50.8% -28.3% Operating Expenses % of sales 87.0 42.7% 95.2 56.8% +9.4% Operating Profit % margin 31.8 15.6% -10.0 -6.0% -131.4% Pre-tax Profit (Loss) % margin 30.4 14.9% -10.8 -6.4% -135.4% Tax Rate 1.1% 104.6% EBITDA 40.0 -1.5 -103.6% Net Income % margin 30.1 14.8% 0.7 0.4% -97.8% EPS (Diluted) $0.58 $0.01 -98.3% Diluted Shares 52.3 53.1 +1.6% Recognized a non-cash goodwill and other intangible assets impairment expense of $910 million in the third quarter
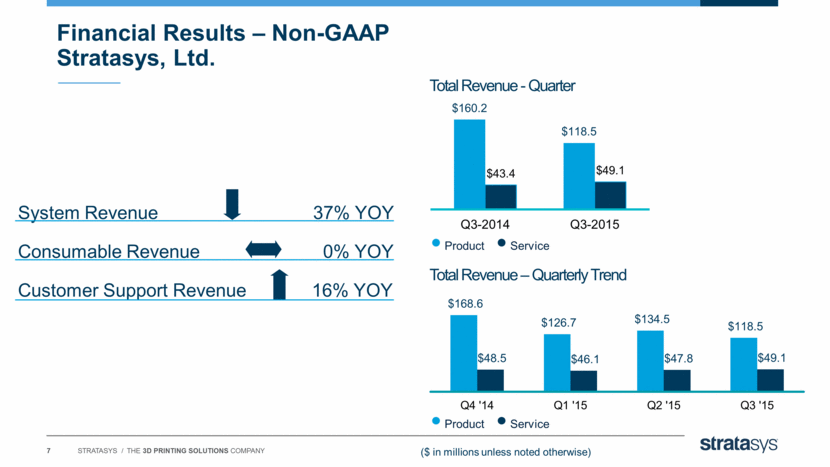
Financial Results – Non-GAAP Stratasys, Ltd. ($ in millions unless noted otherwise) Total Revenue - Quarter Total Revenue – Quarterly Trend Product Service System Revenue 37% YOY Consumable Revenue 0% YOY Customer Support Revenue 16% YOY Product Service $168.6 $126.7 $134.5 $118.5 $48.5 $46.1 $47.8 $49.1 Q4 '14 Q1 '15 Q2 '15 Q3 '15 $160.2 $118.5 $43.4 $49.1 Q3-2014 Q3-2015
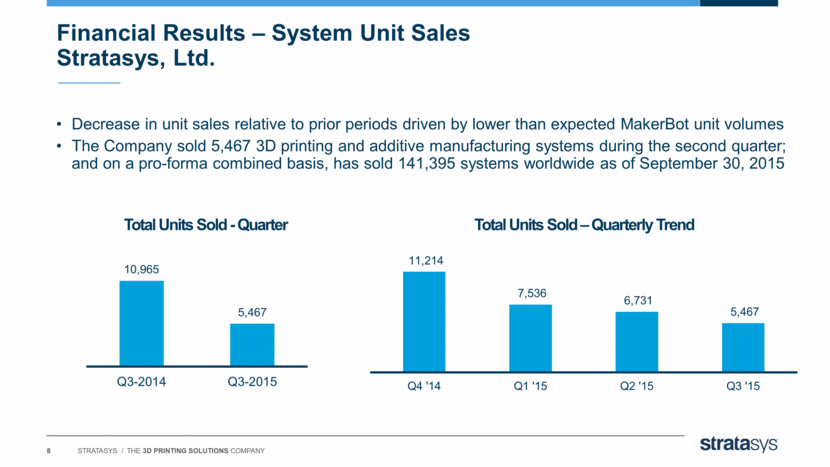
Decrease in unit sales relative to prior periods driven by lower than expected MakerBot unit volumes The Company sold 5,467 3D printing and additive manufacturing systems during the second quarter; and on a pro-forma combined basis, has sold 141,395 systems worldwide as of September 30, 2015 Total Units Sold - Quarter Total Units Sold – Quarterly Trend Financial Results – System Unit Sales Stratasys, Ltd. 11,214 7,536 6,731 5,467 Q4 '14 Q1 '15 Q2 '15 Q3 '15 10,965 5,467 Q3-2014 Q3-2015
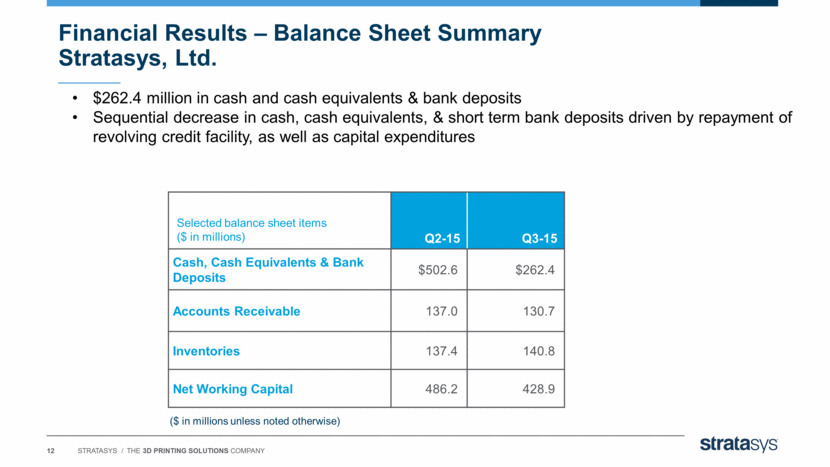
Financial Results – Non-GAAP Stratasys, Ltd. ($ in millions unless noted otherwise) Q3-14 Q3-15 % Change YOY Product Revenue % of sales $160.2 78.7% $118.5 70.7% -26.0% Service Revenue % of sales 43.4 21.3% 49.1 29.3% +13.1% Product Gross Profit % margin 101.5 63.4% 69.6 58.7% -31.5% Service Gross Profit % margin 17.3 39.9% 15.6 31.8% -9.7% Total Gross Profit % margin 118.8 58.4% 85.2 50.8% -28.3% Gross Margin – Quarterly Trend Product Gross Margin Service Gross Margin Total Gross Margin 59.4% 58.6% 61.6% 58.7% 44.3% 41.7% 35.4% 31.8% 56.0% 54.1% 54.7% 50.8% Q4 '14 Q1 '15 Q2 '15 Q3 '15
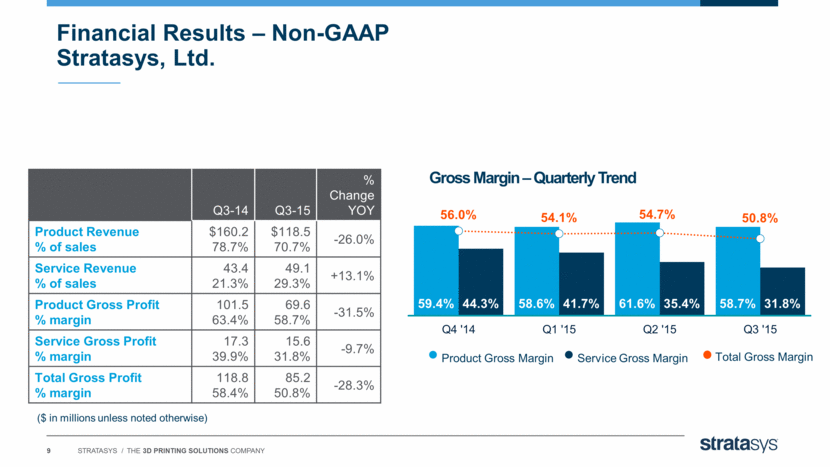
Financial Results – Operating Profit Non-GAAP Stratasys, LTD. ($ in millions unless noted otherwise) Operating Profit Analysis – Quarterly Trend Q3-14 Q3-15 % Change YOY R&D Expense % of sales 19.2 9.4% 25.1 15.0% +30.8% SG&A Expense % of sales 67.9 33.3% 70.1 41.8% +3.3% Total Operating Exp. % of sales 87.0 42.7% 95.2 56.8% +9.4% Total Operating Profit (Loss) % margin 31.8 15.6% -10.0 -6.0% -131.4% R&D Expenses (% of sales) SGA Expenses (% of sales) Operating Margin R&D expansion driven by increased headcount, and an acceleration of system and material development SG&A expansion driven by the impact of acquisitions 9.8% 14.1% 12.3% 15.0% 34.7% 40.4% 40.3% 41.8% 11.5% - 0.4% 2.0% - 6.0% Q4 '14 Q1 '15 Q2 '15 Q3 '15
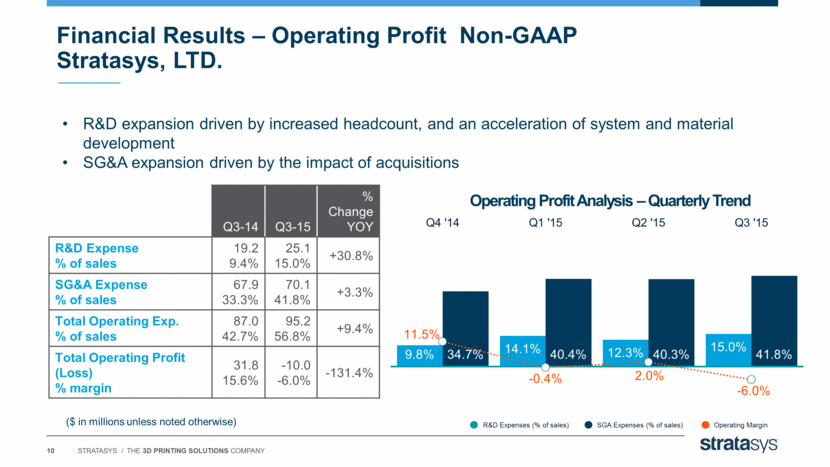
Geographic Sales Q3-2014 North America EMEA APAC Other Geographic Sales Q3-2015 North America EMEA APAC Other Results reflect broad-based weakness Expect challenging market condition to persist for the remainder of 2015 Financial Results – Revenue Geographic Mix Non-GAAP Stratasys, Ltd.
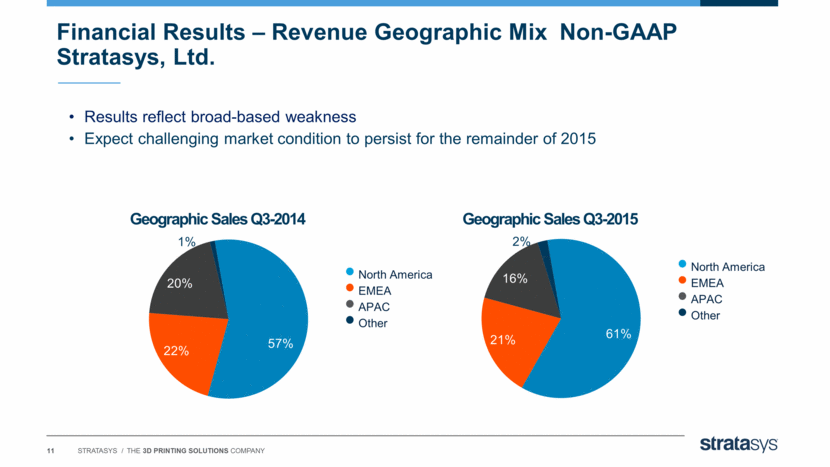
($ in millions unless noted otherwise) Q2-15 Q3-15 Cash, Cash Equivalents & Bank Deposits $502.6 $262.4 Accounts Receivable 137.0 130.7 Inventories 137.4 140.8 Net Working Capital 486.2 428.9 $262.4 million in cash and cash equivalents & bank deposits Sequential decrease in cash, cash equivalents, & short term bank deposits driven by repayment of revolving credit facility, as well as capital expenditures Financial Results – Balance Sheet Summary Stratasys, Ltd. Selected balance sheet items ($ in millions)
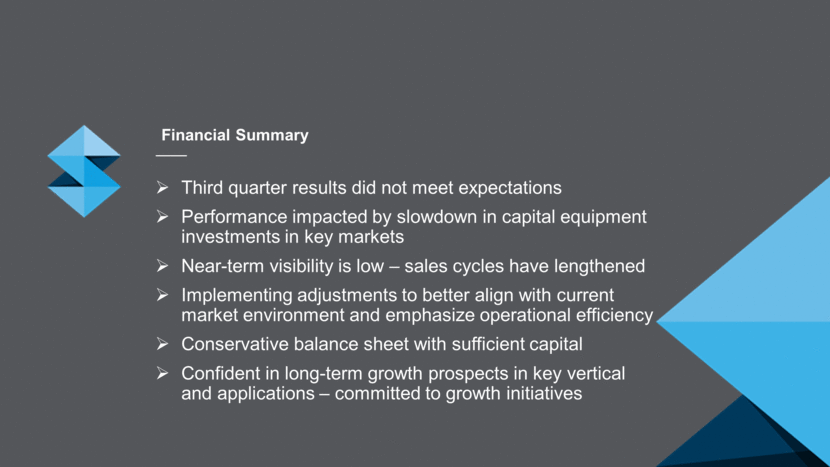
Financial Summary Third quarter results did not meet expectations Performance impacted by slowdown in capital equipment investments in key markets Near-term visibility is low – sales cycles have lengthened Implementing adjustments to better align with current market environment and emphasize operational efficiency Conservative balance sheet with sufficient capital Confident in long-term growth prospects in key vertical and applications – committed to growth initiatives
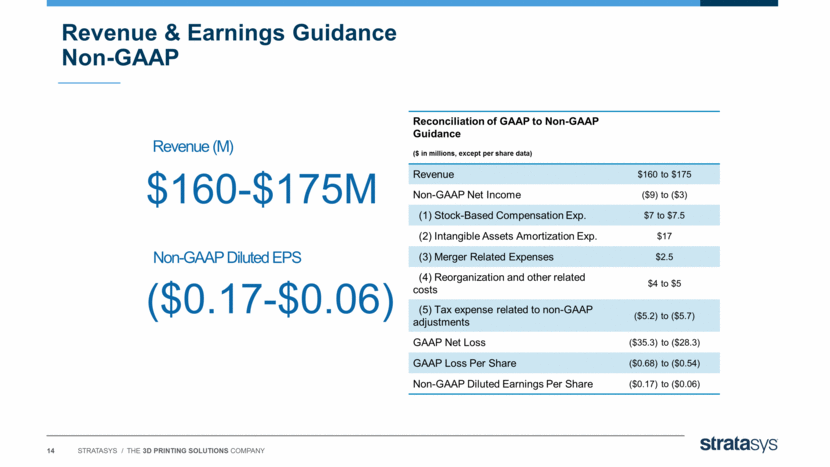
Revenue & Earnings Guidance Non-GAAP $160-$175M ($0.17-$0.06) Revenue (M) Non-GAAP Diluted EPS Reconciliation of GAAP to Non-GAAP Guidance ($ in millions, except per share data) Revenue $160 to $175 Non-GAAP Net Income ($9) to ($3) (1) Stock-Based Compensation Exp. $7 to $7.5 (2) Intangible Assets Amortization Exp. $17 (3) Merger Related Expenses $2.5 (4) Reorganization and other related costs $4 to $5 (5) Tax expense related to non-GAAP adjustments ($5.2) to ($5.7) GAAP Net Loss ($35.3) to ($28.3) GAAP Loss Per Share ($0.68) to ($0.54) Non-GAAP Diluted Earnings Per Share ($0.17) to ($0.06)
STRATEGIC OVERVIEW David Reis – CEO
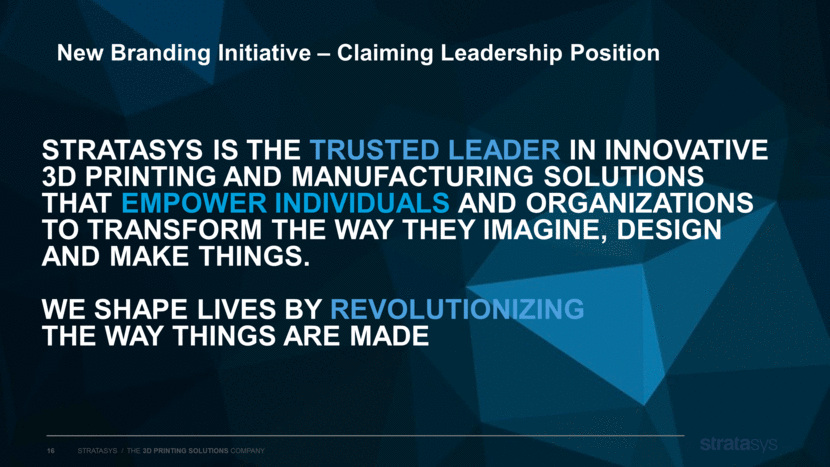
STRATASYS IS THE TRUSTED LEADER IN INNOVATIVE 3D PRINTING AND MANUFACTURING SOLUTIONS THAT EMPOWER INDIVIDUALS AND ORGANIZATIONS TO TRANSFORM THE WAY THEY IMAGINE, DESIGN AND MAKE THINGS. WE SHAPE LIVES BY REVOLUTIONIZING THE WAY THINGS ARE MADE New Branding Initiative – Claiming Leadership Position
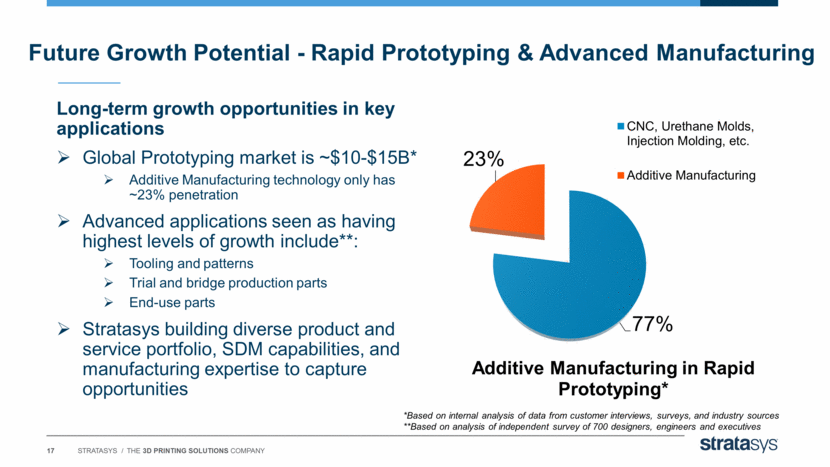
Future Growth Potential - Rapid Prototyping & Advanced Manufacturing Long-term growth opportunities in key applications Global Prototyping market is ~$10-$15B* Additive Manufacturing technology only has ~23% penetration Advanced applications seen as having highest levels of growth include**: Tooling and patterns Trial and bridge production parts End-use parts Stratasys building diverse product and service portfolio, SDM capabilities, and manufacturing expertise to capture opportunities *Based on internal analysis of data from customer interviews, surveys, and industry sources **Based on analysis of independent survey of 700 designers, engineers and executives 77% 23% Additive Manufacturing in Rapid Prototyping* CNC, Urethane Molds, Injection Molding, etc. Additive Manufacturing
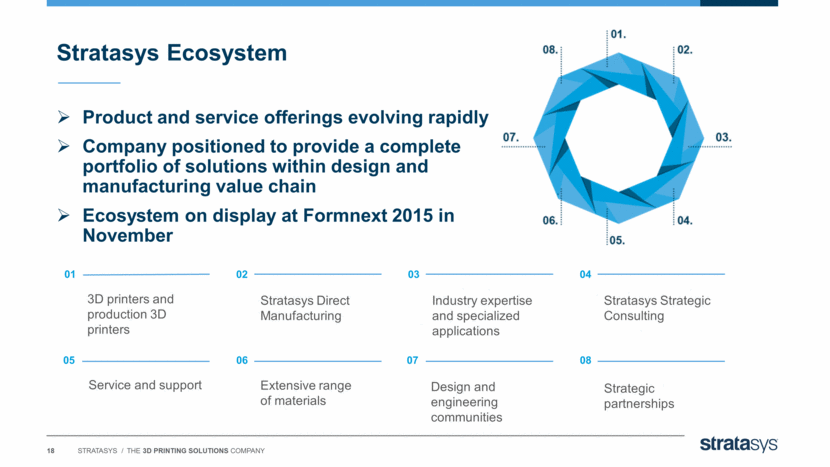
Stratasys Ecosystem Product and service offerings evolving rapidly Company positioned to provide a complete portfolio of solutions within design and manufacturing value chain Ecosystem on display at Formnext 2015 in November 3D printers and production 3D printers Stratasys Direct Manufacturing Industry expertise and specialized applications Stratasys Strategic Consulting Service and support Extensive range of materials Design and engineering communities Strategic partnerships 01 05 02 06 03 07 04 08
Key executives in place New Chief Business Officer New North American President Initiatives Underway – More to come Development of inside sales team to support channel partners Improved training, support, and sales enablement of existing channel Continue to pursue our Strategic Accounts Management and Vertical Business Unit initiatives Early Results Encouraging North American Strategic Accounts revenue increased in Q3 2015 by 137% Y/Y Go-to-Market Transformation
Making Progress in MakerBot Reorganization Operational improvements to improve efficiency Enhancement to leadership team Consolidated facilities Shifting legacy 4TH generation product production to contract manufacturer On track for improved performance in 2016 Evaluating Adjustments to Overall Cost Structure Adapting to market environment Company-wide focus on efficiency and profitability Operational Adjustments
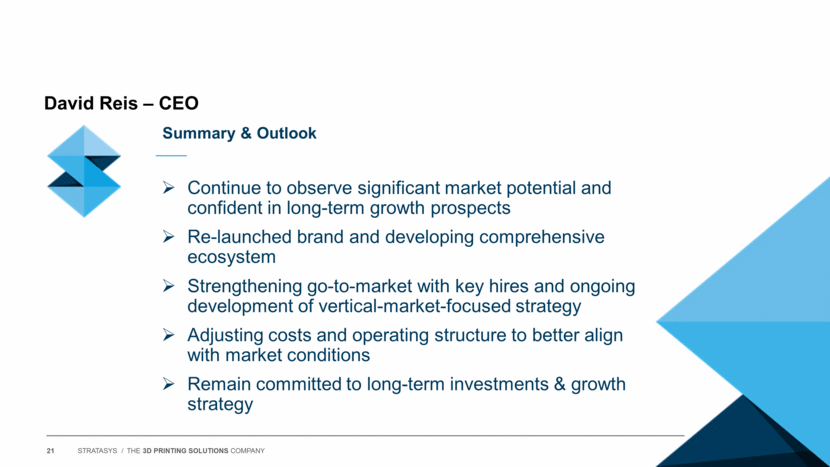
Summary & Outlook Continue to observe significant market potential and confident in long-term growth prospects Re-launched brand and developing comprehensive ecosystem Strengthening go-to-market with key hires and ongoing development of vertical-market-focused strategy Adjusting costs and operating structure to better align with market conditions Remain committed to long-term investments & growth strategy David Reis – CEO
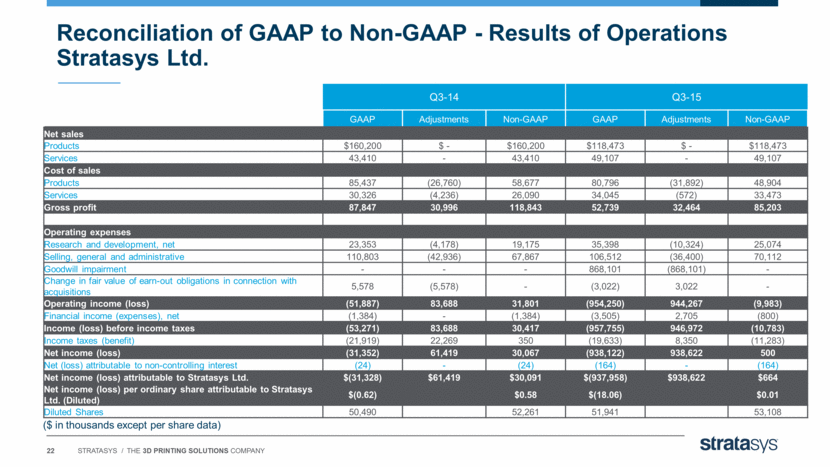
Reconciliation of GAAP to Non-GAAP - Results of Operations Stratasys Ltd. Q3-14 Q3-15 GAAP Adjustments Non-GAAP GAAP Adjustments Non-GAAP Net sales Products $160,200 $ - $160,200 $118,473 $ - $118,473 Services 43,410 - 43,410 49,107 - 49,107 Cost of sales Products 85,437 (26,760) 58,677 80,796 (31,892) 48,904 Services 30,326 (4,236) 26,090 34,045 (572) 33,473 Gross profit 87,847 30,996 118,843 52,739 32,464 85,203 Operating expenses Research and development, net 23,353 (4,178) 19,175 35,398 (10,324) 25,074 Selling, general and administrative 110,803 (42,936) 67,867 106,512 (36,400) 70,112 Goodwill impairment - - - 868,101 (868,101) - Change in fair value of earn-out obligations in connection with acquisitions 5,578 (5,578) - (3,022) 3,022 - Operating income (loss) (51,887) 83,688 31,801 (954,250) 944,267 (9,983) Financial income (expenses), net (1,384) - (1,384) (3,505) 2,705 (800) Income (loss) before income taxes (53,271) 83,688 30,417 (957,755) 946,972 (10,783) Income taxes (benefit) (21,919) 22,269 350 (19,633) 8,350 (11,283) Net income (loss) (31,352) 61,419 30,067 (938,122) 938,622 500 Net (loss) attributable to non-controlling interest (24) - (24) (164) - (164) Net income (loss) attributable to Stratasys Ltd. $(31,328) $61,419 $30,091 $(937,958) $938,622 $664 Net income (loss) per ordinary share attributable to Stratasys Ltd. (Diluted) $(0.62) $0.58 $(18.06) $0.01 Diluted Shares 50,490 52,261 51,941 53,108 ($ in thousands except per share data)
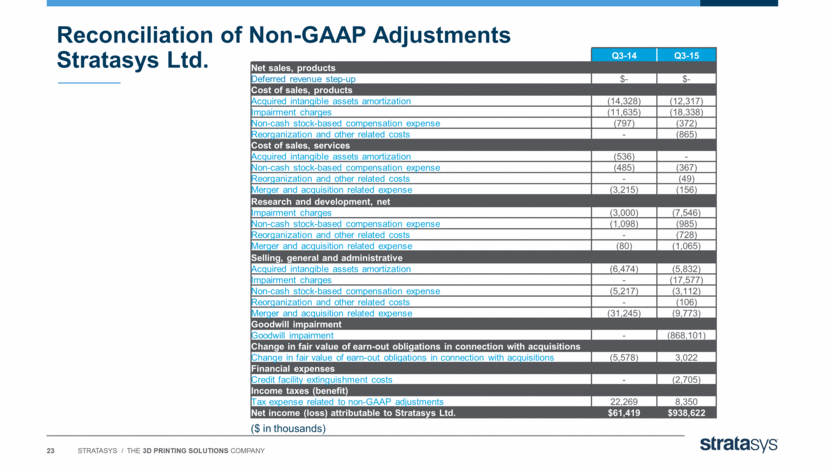
Reconciliation of Non-GAAP Adjustments Stratasys Ltd. Q3-14 Q3-15 Net sales, products Deferred revenue step-up $- $- Cost of sales, products Acquired intangible assets amortization (14,328) (12,317) Impairment charges (11,635) (18,338) Non-cash stock-based compensation expense (797) (372) Reorganization and other related costs - (865) Cost of sales, services Acquired intangible assets amortization (536) - Non-cash stock-based compensation expense (485) (367) Reorganization and other related costs - (49) Merger and acquisition related expense (3,215) (156) Research and development, net Impairment charges (3,000) (7,546) Non-cash stock-based compensation expense (1,098) (985) Reorganization and other related costs - (728) Merger and acquisition related expense (80) (1,065) Selling, general and administrative Acquired intangible assets amortization (6,474) (5,832) Impairment charges - (17,577) Non-cash stock-based compensation expense (5,217) (3,112) Reorganization and other related costs - (106) Merger and acquisition related expense (31,245) (9,773) Goodwill impairment Goodwill impairment - (868,101) Change in fair value of earn-out obligations in connection with acquisitions Change in fair value of earn-out obligations in connection with acquisitions (5,578) 3,022 Financial expenses Credit facility extinguishment costs - (2,705) Income taxes (benefit) Tax expense related to non-GAAP adjustments 22,269 8,350 Net income (loss) attributable to Stratasys Ltd. $61,419 $938,622 ($ in thousands)
