Exhibit 99.3
|
|
Q1 2015 Financial Results Conference Call |
Exhibit 99.3
|
|
Q1 2015 Financial Results Conference Call |
|
|
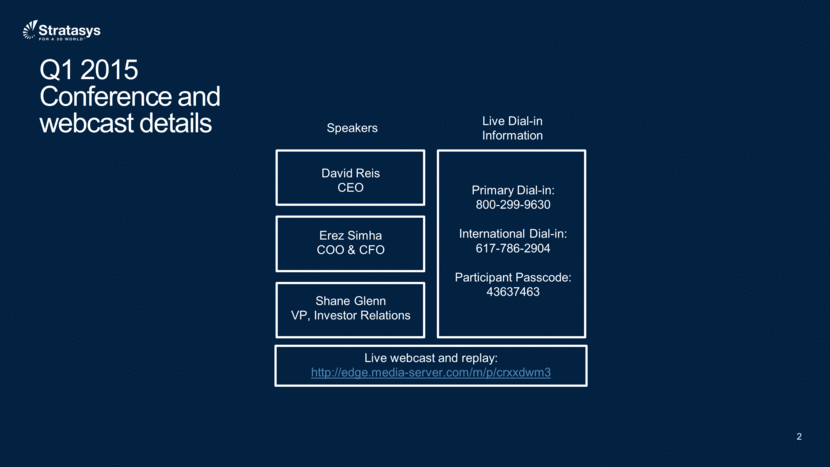
Q1 2015 Conference and webcast details Live Dial-in Information Primary Dial-in: 800-299-9630 International Dial-in: 617-786-2904 Participant Passcode: 43637463 Live webcast and replay: http://edge.media-server.com/m/p/crxxdwm3 Speakers David Reis CEO Erez Simha COO & CFO Shane Glenn VP, Investor Relations |
|
|
Stratasys Forward looking statement Certain information included or incorporated in this presentation may be deemed to be forward-looking statements within the meaning of the Private Securities Litigation Reform Act of 1995, Section 27A of the Securities Act of 1933 and Section 21E of the Securities Exchange Act of 1934. Forward-looking statements are often characterized by the use of forward-looking terminology such as may, will, expect, anticipate, estimate, continue, believe, should, intend, project or other similar words, but are not the only way these statements are identified. These forward-looking statements may include, but are not limited to, statements related to the Company's objectives, plans, strategies, statements that contain projections of results of operations or financial conditions, including with respect to the MakerBot, Solid Concepts, Harvest Technologies and GrabCAD acquisitions, and all statements other than statements of historical fact that address activities, events or developments that the Company intends, expects, projects, believes or anticipates will or may occur in the future. Forward-looking statements are not guarantees of future performance and are subject to risks and uncertainties. The Company has based these forward-looking statements on assumptions and assessments made by its management in light of their experience and their perception of historical trends, current conditions, expected future developments and other factors they believe to be appropriate. Important factors that could cause actual results, developments and business decisions to differ materially from those anticipated in these forward-looking statements include, among other things, the extent of our success at introducing new or improved products and solutions that gain market share; the extent of our success at efficiently and successfully integrating the operations of various companies that we have acquired or may acquire; the impact of competition and new technologies general market, political and economic conditions in the countries in which we operate; projected capital expenditures and liquidity; changes in our strategy; government regulations and approvals; changes in customers' budgeting priorities; the overall global economic environment; litigation and regulatory proceedings; and those factors referred to under Risk Factors, Information on the Company, Operating and Financial Review and Prospects and generally in the Company's annual report for 2014 to be filed on Form 20-F on March 3, 2015 and in other reports that the Company files with the SEC. Readers are urged to carefully review and consider the various disclosures made in the Company's SEC reports, which are designed to advise interested parties of the risks and factors that may affect its business, financial condition, results of operations and prospects. Any forward-looking statements in this presentation are made as of the date hereof, and the Company undertakes no obligation to publicly update or revise any forward-looking statements, whether as a result of new information, future events or otherwise, except as required by law. |
|
|
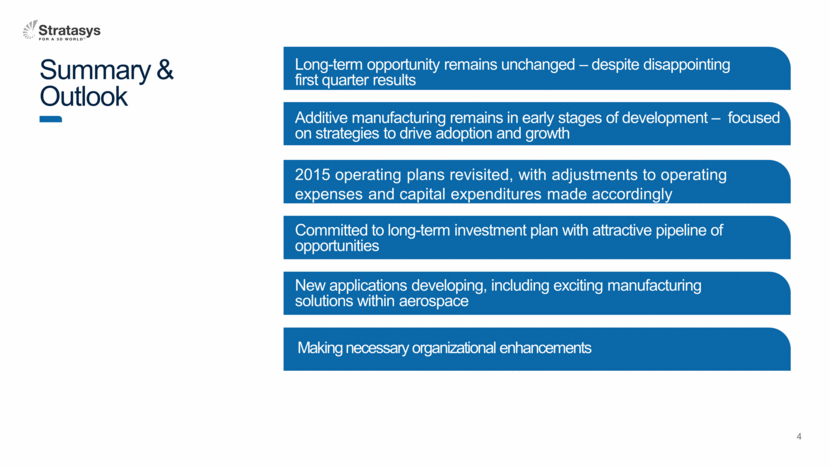
Summary & Outlook Long-term opportunity remains unchanged – despite disappointing first quarter results 2015 operating plans revisited, with adjustments to operating expenses and capital expenditures made accordingly New applications developing, including exciting manufacturing solutions within aerospace Committed to long-term investment plan with attractive pipeline of opportunities Additive manufacturing remains in early stages of development – focused on strategies to drive adoption and growth Making necessary organizational enhancements |
|
|
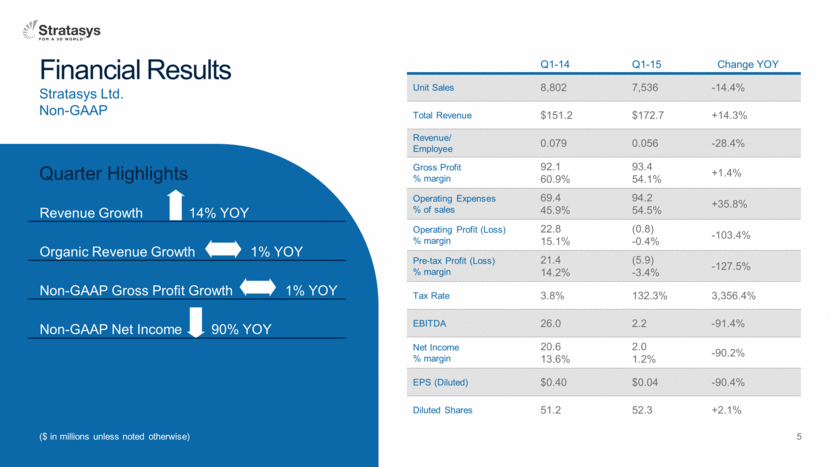
Financial Results Stratasys Ltd. Non-GAAP Q1-14 Q1-15 Change YOY Unit Sales 8,802 7,536 -14.4% Total Revenue $151.2 $172.7 +14.3% Revenue/ Employee 0.079 0.056 -28.4% Gross Profit % margin 92.1 60.9% 93.4 54.1% +1.4% Operating Expenses % of sales 69.4 45.9% 94.2 54.5% +35.8% Operating Profit (Loss) % margin 22.8 15.1% (0.8) -0.4% -103.4% Pre-tax Profit (Loss) % margin 21.4 14.2% (5.9) -3.4% -127.5% Tax Rate 3.8% 132.3% 3,356.4% EBITDA 26.0 2.2 -91.4% Net Income % margin 20.6 13.6% 2.0 1.2% -90.2% EPS (Diluted) $0.40 $0.04 -90.4% Diluted Shares 51.2 52.3 +2.1% ($ in millions unless noted otherwise) Revenue Growth 14% YOY Organic Revenue Growth 1% YOY Non-GAAP Gross Profit Growth 1% YOY Non-GAAP Net Income 90% YOY |
|
|
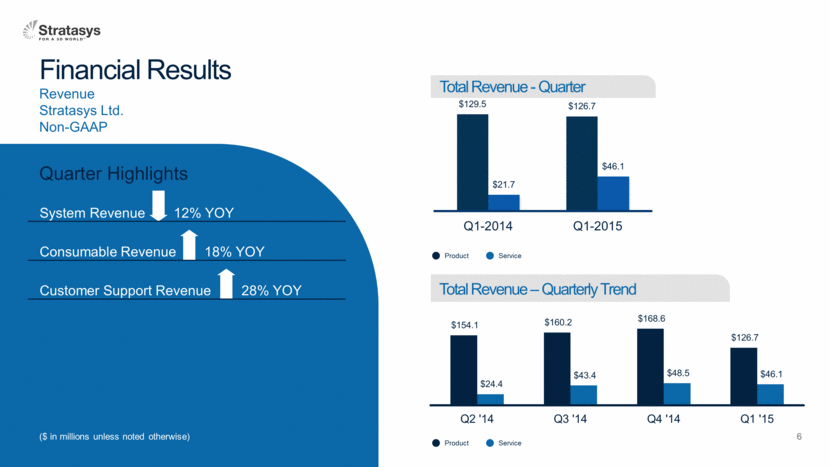
Financial Results Revenue Stratasys Ltd. Non-GAAP Total Revenue - Quarter Total Revenue – Quarterly Trend Product Service Product Service System Revenue 12% YOY Consumable Revenue 18% YOY Customer Support Revenue 28% YOY ($ in millions unless noted otherwise) $154.1 $160.2 $168.6 $126.7 $24.4 $43.4 $48.5 $46.1 Q2 '14 Q3 '14 Q4 '14 Q1 '15 $129.5 $126.7 $21.7 $46.1 Q1-2014 Q1-2015 |
|
|
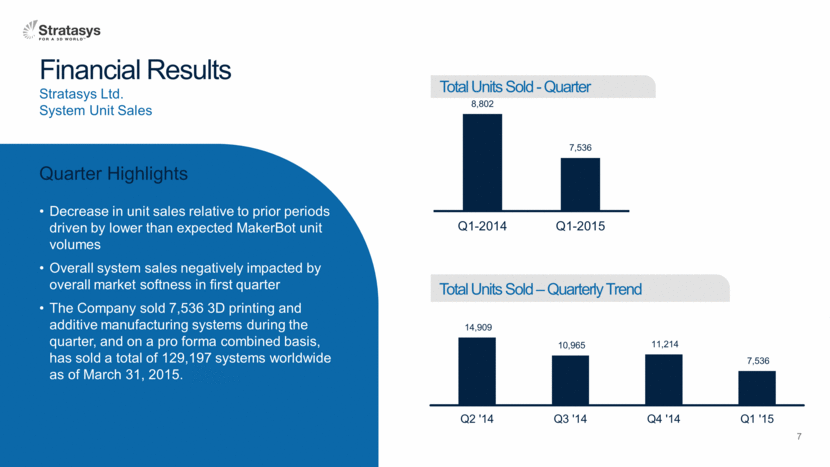
Financial Results Decrease in unit sales relative to prior periods driven by lower than expected MakerBot unit volumes Overall system sales negatively impacted by overall market softness in first quarter The Company sold 7,536 3D printing and additive manufacturing systems during the quarter, and on a pro forma combined basis, has sold a total of 129,197 systems worldwide as of March 31, 2015. Stratasys Ltd. System Unit Sales Total Units Sold - Quarter Total Units Sold – Quarterly Trend 14,909 10,965 11,214 7,536 Q2 '14 Q3 '14 Q4 '14 Q1 '15 8,802 7,536 Q1-2014 Q1-2015 |
|
|
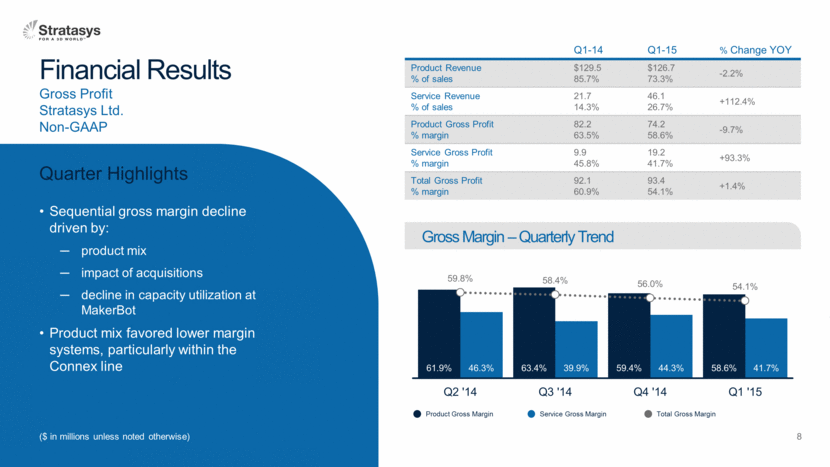
Financial Results Sequential gross margin decline driven by: product mix impact of acquisitions decline in capacity utilization at MakerBot Product mix favored lower margin systems, particularly within the Connex line Gross Profit Stratasys Ltd. Non-GAAP Q1-14 Q1-15 % Change YOY Product Revenue % of sales $129.5 85.7% $126.7 73.3% -2.2% Service Revenue % of sales 21.7 14.3% 46.1 26.7% +112.4% Product Gross Profit % margin 82.2 63.5% 74.2 58.6% -9.7% Service Gross Profit % margin 9.9 45.8% 19.2 41.7% +93.3% Total Gross Profit % margin 92.1 60.9% 93.4 54.1% +1.4% Gross Margin – Quarterly Trend ($ in millions unless noted otherwise) Product Gross Margin Service Gross Margin Total Gross Margin 61.9% 63.4% 59.4% 58.6% 46.3% 39.9% 44.3% 41.7% 59.8% 58.4% 56.0% 54.1% Q2 '14 Q3 '14 Q4 '14 Q1 '15 |
|
|
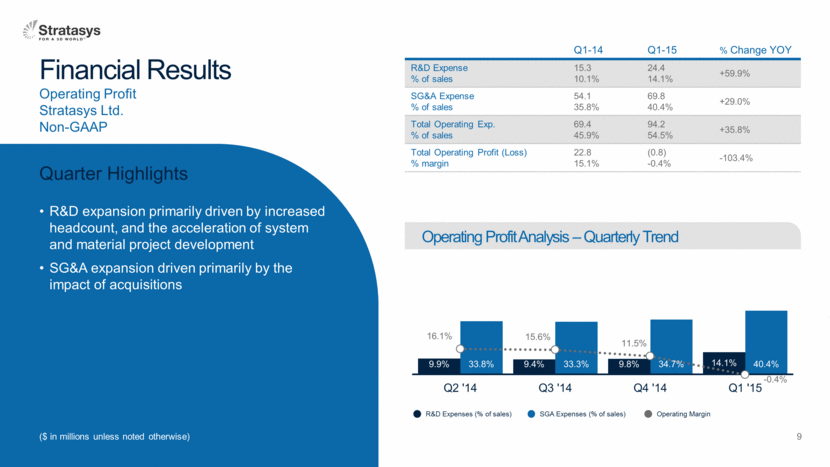
Financial Results R&D expansion primarily driven by increased headcount, and the acceleration of system and material project development SG&A expansion driven primarily by the impact of acquisitions Operating Profit Stratasys Ltd. Non-GAAP Operating Profit Analysis – Quarterly Trend Q1-14 Q1-15 % Change YOY R&D Expense % of sales 15.3 10.1% 24.4 14.1% +59.9% SG&A Expense % of sales 54.1 35.8% 69.8 40.4% +29.0% Total Operating Exp. % of sales 69.4 45.9% 94.2 54.5% +35.8% Total Operating Profit (Loss) % margin 22.8 15.1% (0.8) -0.4% -103.4% R&D Expenses (% of sales) SGA Expenses (% of sales) Operating Margin ($ in millions unless noted otherwise) 9.9% 9.4% 9.8% 14.1% 33.8% 33.3% 34.7% 40.4% 16.1% 15.6% 11.5% - 0.4% Q2 '14 Q3 '14 Q4 '14 Q1 '15 |
|
|
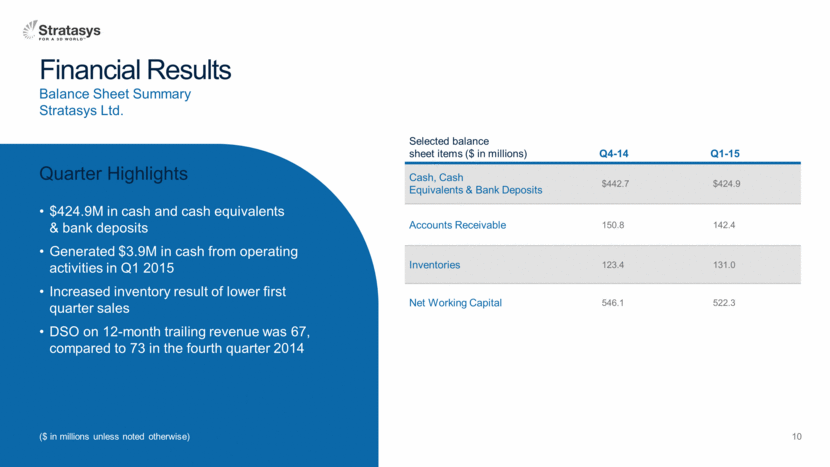
Financial Results $424.9M in cash and cash equivalents & bank deposits Generated $3.9M in cash from operating activities in Q1 2015 Increased inventory result of lower first quarter sales DSO on 12-month trailing revenue was 67, compared to 73 in the fourth quarter 2014 Balance Sheet Summary Stratasys Ltd. Selected balance sheet items ($ in millions) Q4-14 Q1-15 Cash, Cash Equivalents & Bank Deposits $442.7 $424.9 Accounts Receivable 150.8 142.4 Inventories 123.4 131.0 Net Working Capital 546.1 522.3 ($ in millions unless noted otherwise) |
|
|
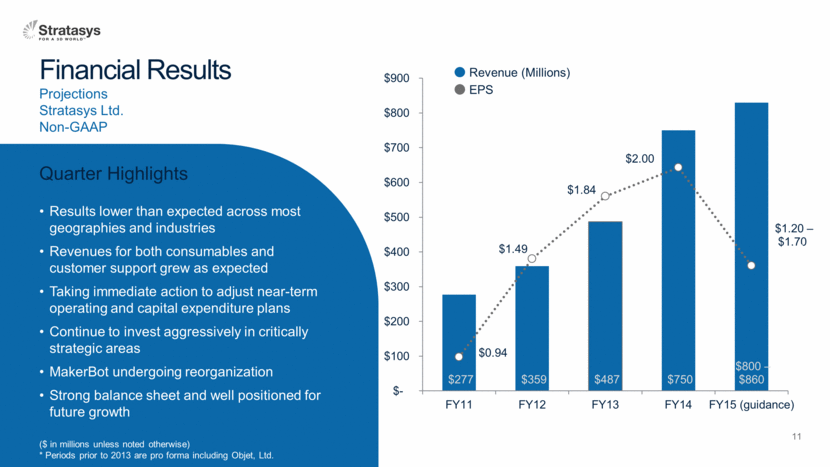
Financial Results Results lower than expected across most geographies and industries Revenues for both consumables and customer support grew as expected Taking immediate action to adjust near-term operating and capital expenditure plans Continue to invest aggressively in critically strategic areas MakerBot undergoing reorganization Strong balance sheet and well positioned for future growth ($ in millions unless noted otherwise) * Periods prior to 2013 are pro forma including Objet, Ltd. Projections Stratasys Ltd. Non-GAAP Revenue (Millions) EPS $277 $359 $487 $750 $800 – $860 $ 0.94 $1.49 $1.84 $ 2.00 $1.20 – $1.70 $- $100 $200 $300 $400 $500 $600 $700 $800 $900 FY11 FY12 FY13 FY14 FY15 (guidance) $0.75 $0.95 $1.15 $1.35 $1.55 $1.75 $1.95 $2.15 $2.35 |
|
|
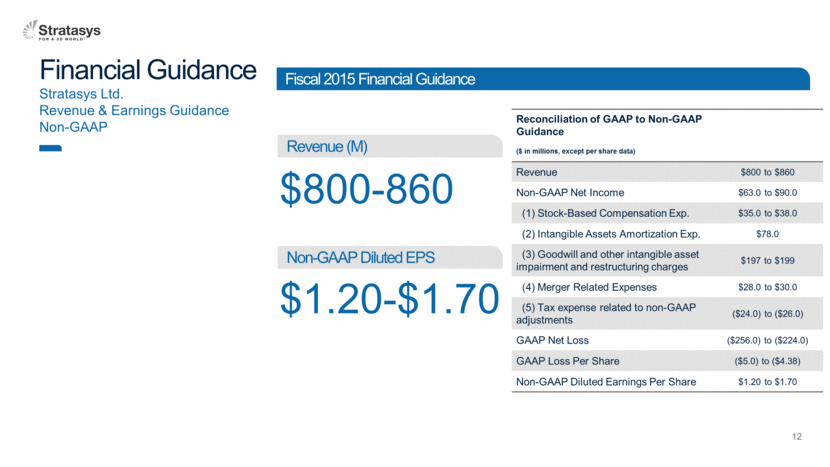
Financial Guidance Stratasys Ltd. Revenue & Earnings Guidance Non-GAAP $800-860 $1.20-$1.70 Revenue (M) Non-GAAP Diluted EPS Fiscal 2015 Financial Guidance Reconciliation of GAAP to Non-GAAP Guidance ($ in millions, except per share data) Revenue $800 to $860 Non-GAAP Net Income $63.0 to $90.0 (1) Stock-Based Compensation Exp. $35.0 to $38.0 (2) Intangible Assets Amortization Exp. $78.0 (3) Goodwill and other intangible asset impairment and restructuring charges $197 to $199 (4) Merger Related Expenses $28.0 to $30.0 (5) Tax expense related to non-GAAP adjustments ($24.0) to ($26.0) GAAP Net Loss ($256.0) to ($224.0) GAAP Loss Per Share ($5.0) to ($4.38) Non-GAAP Diluted Earnings Per Share $1.20 to $1.70 |
|
|
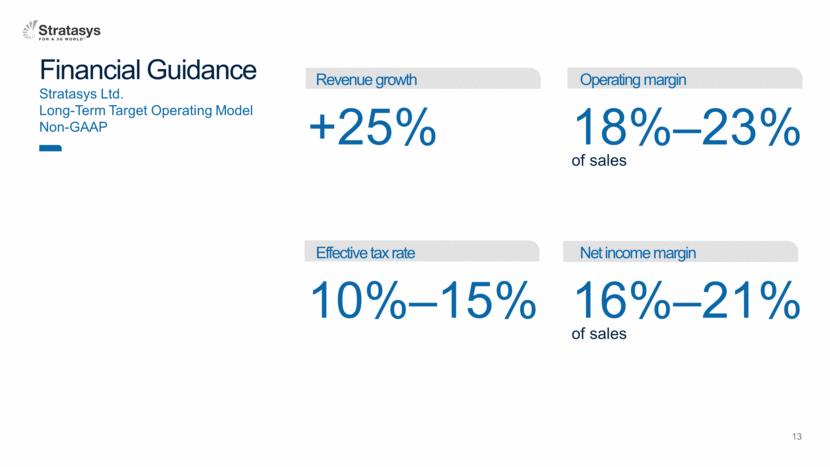
Financial Guidance Stratasys Ltd. Long-Term Target Operating Model Non-GAAP +25% Revenue growth 18%–23% Operating margin 10%–15% Effective tax rate 16%–21% Net income margin of sales of sales |
|
|
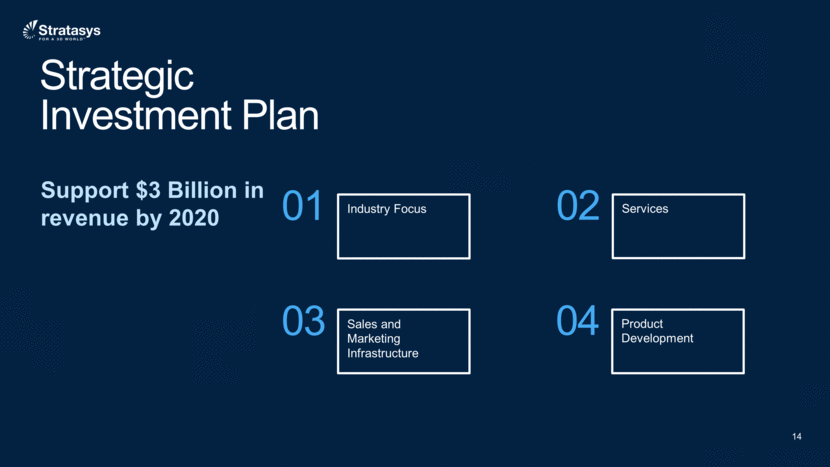
Strategic Investment Plan Industry Focus 01 Services 02 Product Development 04 Sales and Marketing Infrastructure 03 Support $3 Billion in revenue by 2020 |
|
|
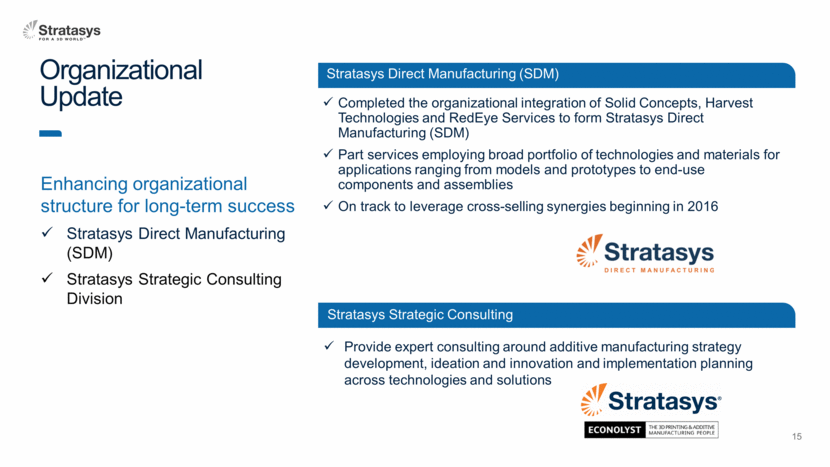
Organizational Update Enhancing organizational structure for long-term success Stratasys Direct Manufacturing (SDM) Stratasys Strategic Consulting Division Completed the organizational integration of Solid Concepts, Harvest Technologies and RedEye Services to form Stratasys Direct Manufacturing (SDM) Part services employing broad portfolio of technologies and materials for applications ranging from models and prototypes to end-use components and assemblies On track to leverage cross-selling synergies beginning in 2016 Stratasys Direct Manufacturing (SDM) Stratasys Strategic Consulting Provide expert consulting around additive manufacturing strategy development, ideation and innovation and implementation planning across technologies and solutions |
|
|
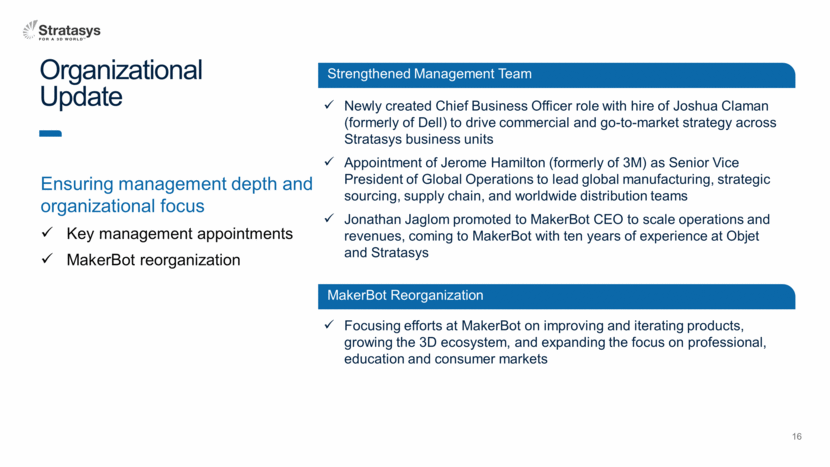
Organizational Update Ensuring management depth and organizational focus Key management appointments MakerBot reorganization Strengthened Management Team Newly created Chief Business Officer role with hire of Joshua Claman (formerly of Dell) to drive commercial and go-to-market strategy across Stratasys business units Appointment of Jerome Hamilton (formerly of 3M) as Senior Vice President of Global Operations to lead global manufacturing, strategic sourcing, supply chain, and worldwide distribution teams Jonathan Jaglom promoted to MakerBot CEO to scale operations and revenues, coming to MakerBot with ten years of experience at Objet and Stratasys MakerBot Reorganization Focusing efforts at MakerBot on improving and iterating products, growing the 3D ecosystem, and expanding the focus on professional, education and consumer markets |
|
|
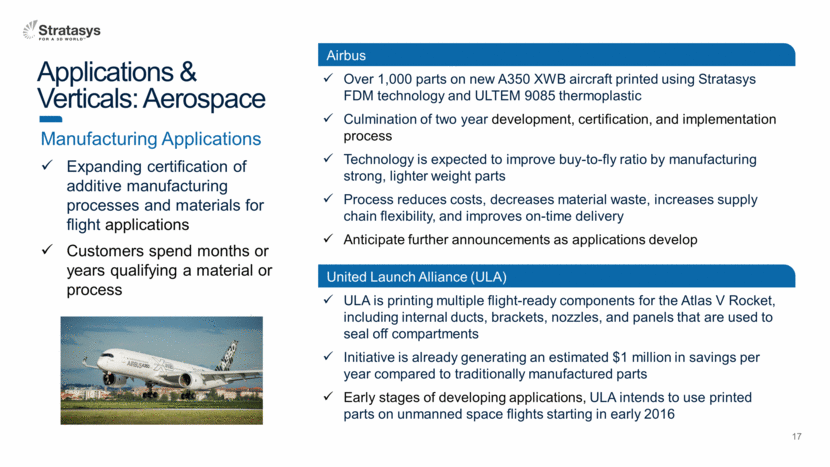
Applications & Verticals: Aerospace Manufacturing Applications Expanding certification of additive manufacturing processes and materials for flight applications Customers spend months or years qualifying a material or process Over 1,000 parts on new A350 XWB aircraft printed using Stratasys FDM technology and ULTEM 9085 thermoplastic Culmination of two year development, certification, and implementation process Technology is expected to improve buy-to-fly ratio by manufacturing strong, lighter weight parts Process reduces costs, decreases material waste, increases supply chain flexibility, and improves on-time delivery Anticipate further announcements as applications develop Airbus ULA is printing multiple flight-ready components for the Atlas V Rocket, including internal ducts, brackets, nozzles, and panels that are used to seal off compartments Initiative is already generating an estimated $1 million in savings per year compared to traditionally manufactured parts Early stages of developing applications, ULA intends to use printed parts on unmanned space flights starting in early 2016 United Launch Alliance (ULA) |
|
|
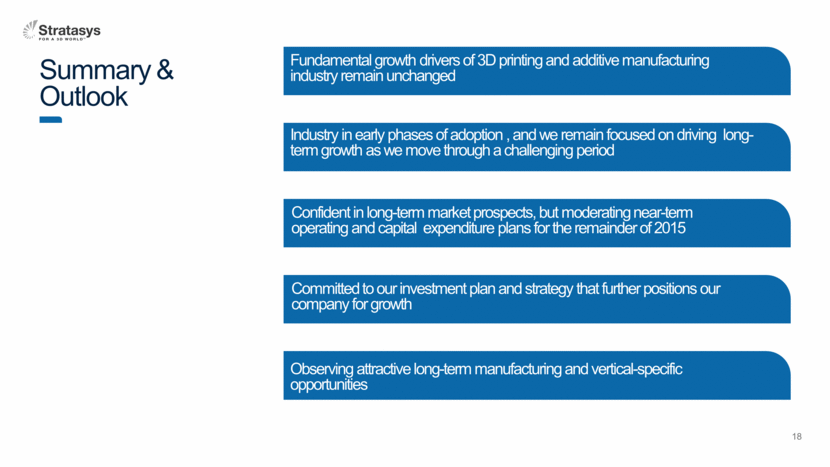
Summary & Outlook Fundamental growth drivers of 3D printing and additive manufacturing industry remain unchanged Industry in early phases of adoption , and we remain focused on driving long-term growth as we move through a challenging period Confident in long-term market prospects, but moderating near-term operating and capital expenditure plans for the remainder of 2015 Committed to our investment plan and strategy that further positions our company for growth Observing attractive long-term manufacturing and vertical-specific opportunities |
|
|
We are Stratasys We are innovation We are fearless leaders We are customer driven Our quality matters Our people make the difference |
|
|
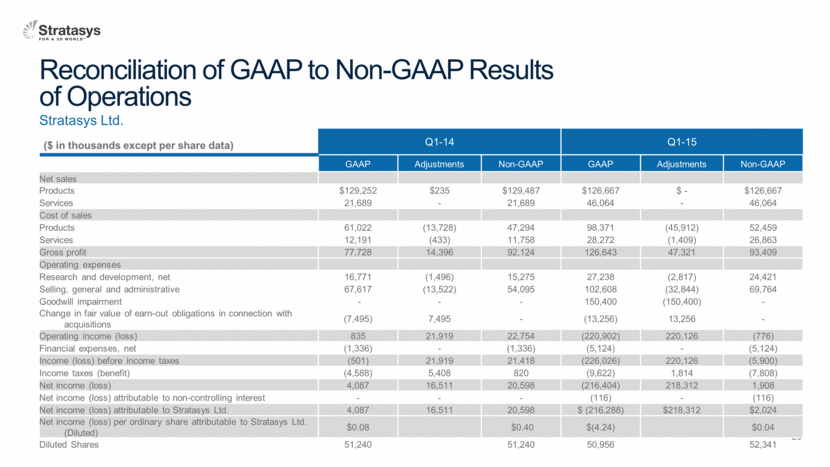
Reconciliation of GAAP to Non-GAAP Results of Operations Stratasys Ltd. ($ in thousands except per share data) Q1-14 Q1-15 GAAP Adjustments Non-GAAP GAAP Adjustments Non-GAAP Net sales Products $129,252 $235 $129,487 $126,667 $ - $126,667 Services 21,689 - 21,689 46,064 - 46,064 Cost of sales Products 61,022 (13,728) 47,294 98,371 (45,912) 52,459 Services 12,191 (433) 11,758 28,272 (1,409) 26,863 Gross profit 77,728 14,396 92,124 126,643 47,321 93,409 Operating expenses Research and development, net 16,771 (1,496) 15,275 27,238 (2,817) 24,421 Selling, general and administrative 67,617 (13,522) 54,095 102,608 (32,844) 69,764 Goodwill impairment - - - 150,400 (150,400) - Change in fair value of earn-out obligations in connection with acquisitions (7,495) 7,495 - (13,256) 13,256 - Operating income (loss) 835 21,919 22,754 (220,902) 220,126 (776) Financial expenses, net (1,336) - (1,336) (5,124) - (5,124) Income (loss) before income taxes (501) 21,919 21,418 (226,026) 220,126 (5,900) Income taxes (benefit) (4,588) 5,408 820 (9,622) 1,814 (7,808) Net income (loss) 4,087 16,511 20,598 (216,404) 218,312 1,908 Net income (loss) attributable to non-controlling interest - - - (116) - (116) Net income (loss) attributable to Stratasys Ltd. 4,087 16,511 20,598 $ (216,288) $218,312 $2,024 Net income (loss) per ordinary share attributable to Stratasys Ltd. (Diluted) $0.08 $0.40 $(4.24) $0.04 Diluted Shares 51,240 51,240 50,956 52,341 |
|
|
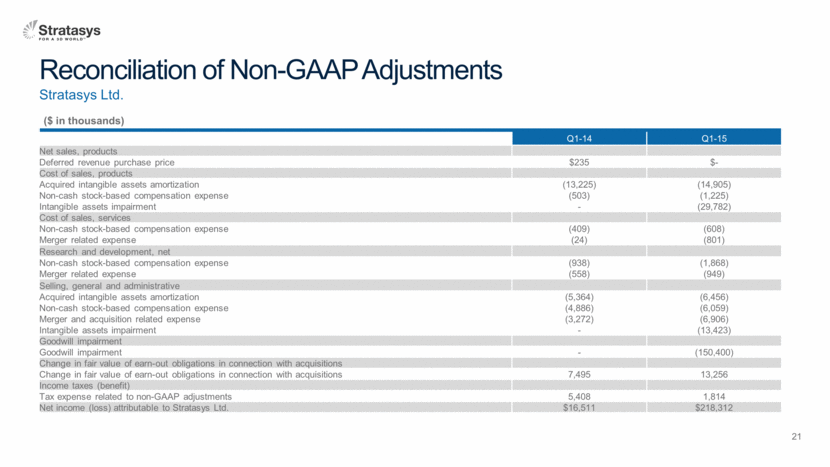
Reconciliation of Non-GAAP Adjustments Stratasys Ltd. ($ in thousands) Q1-14 Q1-15 Net sales, products Deferred revenue purchase price $235 $- Cost of sales, products Acquired intangible assets amortization (13,225) (14,905) Non-cash stock-based compensation expense (503) (1,225) Intangible assets impairment - (29,782) Cost of sales, services Non-cash stock-based compensation expense (409) (608) Merger related expense (24) (801) Research and development, net Non-cash stock-based compensation expense (938) (1,868) Merger related expense (558) (949) Selling, general and administrative Acquired intangible assets amortization (5,364) (6,456) Non-cash stock-based compensation expense (4,886) (6,059) Merger and acquisition related expense (3,272) (6,906) Intangible assets impairment - (13,423) Goodwill impairment Goodwill impairment - (150,400) Change in fair value of earn-out obligations in connection with acquisitions Change in fair value of earn-out obligations in connection with acquisitions 7,495 13,256 Income taxes (benefit) Tax expense related to non-GAAP adjustments 5,408 1,814 Net income (loss) attributable to Stratasys Ltd. $16,511 $218,312 |