Exhibit 99.3
|
|
Q1-2013 Financial Results Conference Call May 13th 2013 |
Exhibit 99.3
|
|
Q1-2013 Financial Results Conference Call May 13th 2013 |
|
|
Q1-2013 Conference and webcast details 2 CEO CFO & COO (IL) Chairman & Chief Innovation Officer Director, Investor Relations David Reis Erez Simha Scott Crump Shane Glenn Speakers Live Dial-in Information PRIMARY DIAL-IN: (877) 415-3182 INTERNATIONAL DIAL-IN: (857) 244-7325 PARTICIPANT PASSCODE: 29258434 PRIMARY DIAL-IN: (888) 286-8010 INTERNATIONAL DIAL-IN: (617) 801-6888 AVAILABLE FROM: 5/13/2013 10:30 AM ET AVAILABLE TO: 5/20/2013 11:59 PM ET PARTICIPANT PASSCODE: 60084154 ONLINE LIVE WEBCAST AND REPLAY: http://www.media-server.com/m/p/usbmvg9b Replay Dial-in Information |
|
|
Stratasys Forward looking statement 3 Statements in this presentation about Stratasys’ beliefs, intentions and expectations, including statements regarding the management of Stratasys, Inc. and Objet Ltd. as a combined company, the benefits of the proposed combination of the companies, and the future financial performance of the combined company after their merger, are forward-looking statements. The statements involve risks and uncertainties, both known and unknown, that may cause actual results to differ materially from those projected in this presentation. Actual results may differ materially due to a number of factors, including the risk and uncertainty that the businesses of the two companies may not be integrated successfully; the risk that the merger may involve unexpected costs or unexpected liabilities; the risk that synergies from the merger may not be fully realized or may take longer to realize than expected; the risk that management’s focus on and disruptions arising from the merger make it more difficult to maintain relationships with customers, employees, or suppliers. Stratasys’ ability to achieve the results presented in any forward-looking statement will depend on numerous factors, including its ability to penetrate the 3D printing market; its ability to achieve the growth rates experienced in preceding quarters; its ability to introduce, produce and market both existing and new consumable materials, and the market acceptance of these materials; the impact of competitive products and pricing; its timely development of new products and materials and market acceptance of those products and materials; the success of Stratasys’ recent R&D initiative to expand the DDM capabilities of its core FDM technology; and the success of Stratasys’ RedEyeOn DemandTM and other paid parts services. These and other applicable factors are discussed in this presentation and in Stratasys’ filings with the Securities and Exchange Commission. These filings include the definitive proxy statement/prospectus filed with the SEC on August 8, 2012, as well as the filings that Stratasys, Inc. has made with the SEC and that Stratasys Ltd. has made and will make with the SEC in the future, including its report on Form 20-F to be filed for the year ended 12/31/2012. Any forward-looking statements included in this presentation are as of the date they are given, and Stratasys does not intend to update them if its views later change, except as may be required by law. These forward-looking statements should not be relied upon as representing Stratasys’ views as of any date subsequent to the date they are given. |
|
|
Opening Remarks Scott Crump, Chairman & Chief Innovation Officer 4 May 13th 2013 |
|
|
Opening Remarks David Reis, CEO 5 May 13th 2013 |
|
|
Released record financial results in Q1. Advanced our sales and marketing integration plan. Initiated a comprehensive marketing campaing to broaden brand awareness. Maintain positive outlook and strong growth expectations. 6 Q1-2013 Conference Call Highlights Introduced an exciting new product targeting the dental market. |
|
|
Discussion of First Quarter Financials Erez Simha, CFO & COO (IL) 7 May 13th 2013 |
|
|
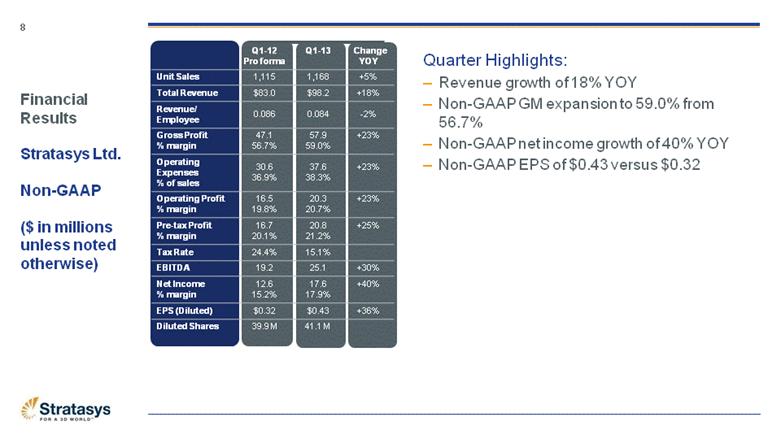
Financial Results Stratasys Ltd. Non-GAAP ($ in millions unless noted otherwise) Q1-12 Pro forma Q1-13 Change YOY Unit Sales 1,115 1,168 +5% Total Revenue $83.0 $98.2 +18% Revenue/ Employee 0.086 0.084 -2% Gross Profit % margin 47.1 56.7% 57.9 59.0% +23% Operating Expenses % of sales 30.6 36.9% 37.6 38.3% +23% Operating Profit % margin 16.5 19.8% 20.3 20.7% +23% Pre-tax Profit % margin 16.7 20.1% 20.8 21.2% +25% Tax Rate 24.4% 15.1% EBITDA 19.2 25.1 +30% Net Income % margin 12.6 15.2% 17.6 17.9% +40% EPS (Diluted) $0.32 $0.43 +36% Diluted Shares 39.9 M 41.1 M 8 Quarter Highlights: Revenue growth of 18% YOY Non-GAAP GM expansion to 59.0% from 56.7% Non-GAAP net income growth of 40% YOY Non-GAAP EPS of $0.43 versus $0.32 |
|
|
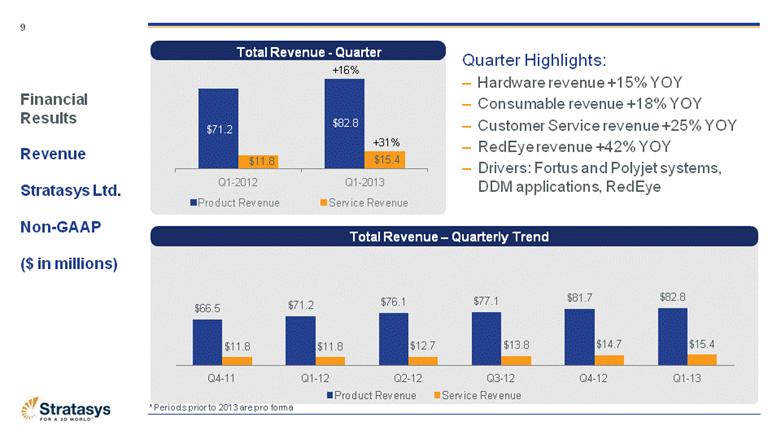
Financial Results Revenue Stratasys Ltd. Non-GAAP ($ in millions) 9 Total Revenue - Quarter Total Revenue – Quarterly Trend +16% +31% Quarter Highlights: Hardware revenue +15% YOY Consumable revenue +18% YOY Customer Service revenue +25% YOY RedEye revenue +42% YOY Drivers: Fortus and Polyjet systems, DDM applications, RedEye * Periods prior to 2013 are pro forma |
|
|
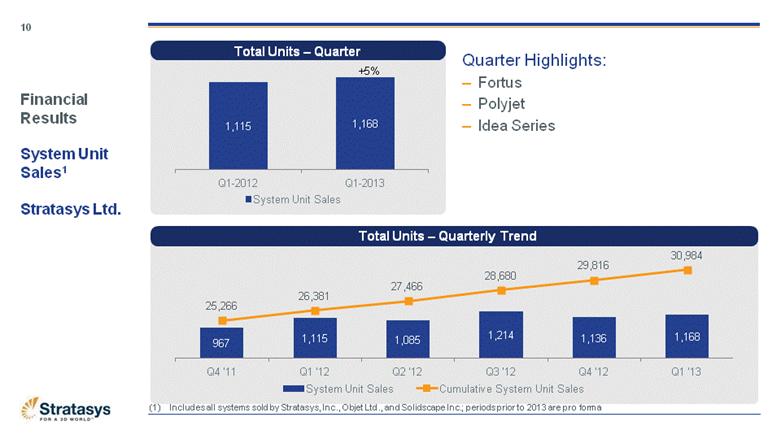
Financial Results System Unit Sales1 Stratasys Ltd. 10 Total Units – Quarter Total Units – Quarterly Trend Includes all systems sold by Stratasys, Inc., Objet Ltd., and Solidscape Inc.; periods prior to 2013 are pro forma +5% Quarter Highlights: Fortus Polyjet Idea Series |
|
|
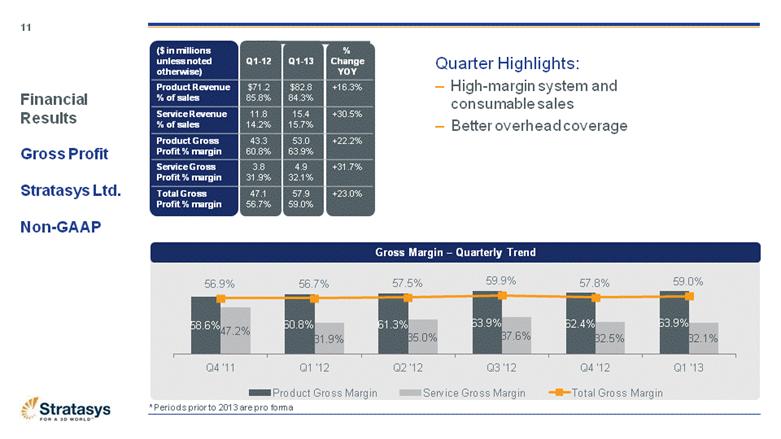
Gross Margin – Quarterly Trend ($ in millions unless noted otherwise) Q1-12 Q1-13 % Change YOY Product Revenue % of sales $71.2 85.8% $82.8 84.3% +16.3% Service Revenue % of sales 11.8 14.2% 15.4 15.7% +30.5% Product Gross Profit % margin 43.3 60.8% 53.0 63.9% +22.2% Service Gross Profit % margin 3.8 31.9% 4.9 32.1% +31.7% Total Gross Profit % margin 47.1 56.7% 57.9 59.0% +23.0% Financial Results Gross Profit Stratasys Ltd. Non-GAAP 11 Quarter Highlights: High-margin system and consumable sales Better overhead coverage * Periods prior to 2013 are pro forma |
|
|
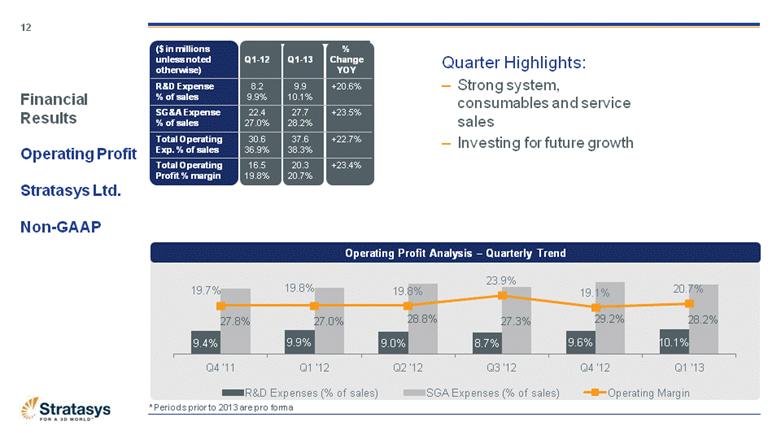
Operating Profit Analysis – Quarterly Trend ($ in millions unless noted otherwise) Q1-12 Q1-13 % Change YOY R&D Expense % of sales 8.2 9.9% 9.9 10.1% +20.6% SG&A Expense % of sales 22.4 27.0% 27.7 28.2% +23.5% Total Operating Exp. % of sales 30.6 36.9% 37.6 38.3% +22.7% Total Operating Profit % margin 16.5 19.8% 20.3 20.7% +23.4% Operating Profit Analysis – Quarterly Trend Financial Results Operating Profit Stratasys Ltd. Non-GAAP 12 Quarter Highlights: Strong system, consumables and service sales Investing for future growth * Periods prior to 2013 are pro forma |
|
|
Q1-2013 (YOY) Units Dollars Systems +5% +15% Consumable Revenue -- +18% Customer Service Revenue -- +25% RedEye Parts Services -- +42% Financial Results Growth Drivers Stratasys Ltd. Non-GAAP 13 |
|
|
Financial Results Revenue Geographic Mix Stratasys Ltd. Non-GAAP 14 * Periods prior to 2013 are pro forma |
|
|
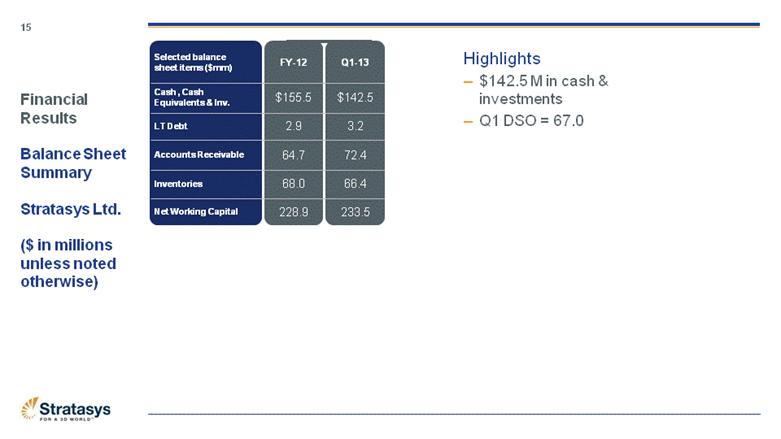
Financial Results Balance Sheet Summary Stratasys Ltd. ($ in millions unless noted otherwise) 15 Selected balance sheet items ($mm) FY-12 Q1-13 Cash , Cash Equivalents & Inv. $155.5 $142.5 LT Debt 2.9 3.2 Accounts Receivable 64.7 72.4 Inventories 68.0 66.4 Net Working Capital 228.9 233.5 Highlights $142.5 M in cash & investments Q1 DSO = 67.0 |
|
|
16 Financial Results & Projections Stratasys Ltd. Non-GAAP ($ in millions unless noted otherwise) * Periods prior to 2013 are pro forma |
|
|
Guidance Overview Shane Glenn VP Investor Relations 17 May 13th 2013 |
|
|
Reconciliation of GAAP to Non-GAAP Guidance ($ in millions unless noted otherwise) Revenue $430 to $445 Non-GAAP Net Income $74.5 to $81.0 (1) Stock-Based Compensation Exp. $20.5 - $23.0 (2) Amortization of Intangibles $60.5 (3) Merger-Related Expenses $7.2 - $8.8 GAAP Net Income ($16.0) – ($6.3) GAAP EPS ($0.41) – ($0.16) Non-GAAP EPS $1.80 - $1.95 Fiscal 2013 Financial Guidance Revenue (M) $430 - 445 Non-GAAP EPS $1.80 - $1.95 Financial Guidance Revenue and Earnings Guidance Stratasys Ltd. Non-GAAP 18 |
|
|
Revenue growth Operating margin1 Net income margin1 Effective tax rate1 +20% 20% – 25% of sales 15% – 20% 16% - 21% of sales Financial Guidance Long-Term Target Operating Model Stratasys Ltd. Non-GAAP 19 1 Non-GAAP. |
|
|
Strategic Overview David Reis, CEO 20 May 13th 2013 |
|
|
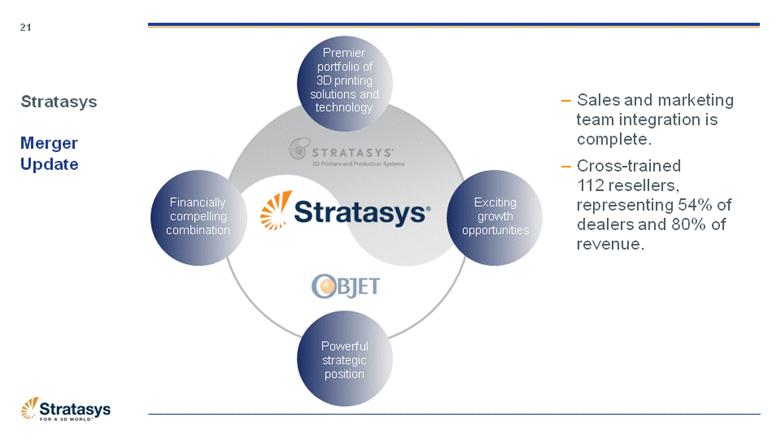
Stratasys Merger Update 21 Sales and marketing team integration is complete. Cross-trained 112 resellers, representing 54% of dealers and 80% of revenue. Exciting growth opportunities Premier portfolio of 3D printing solutions and technology Powerful strategic position Financially compelling combination |
|
|
22 3D Printing Goes Mainstream Financial media: Wall Street Journal Financial Times The Economist (Worldwide) Fortune Forbes |
|
|
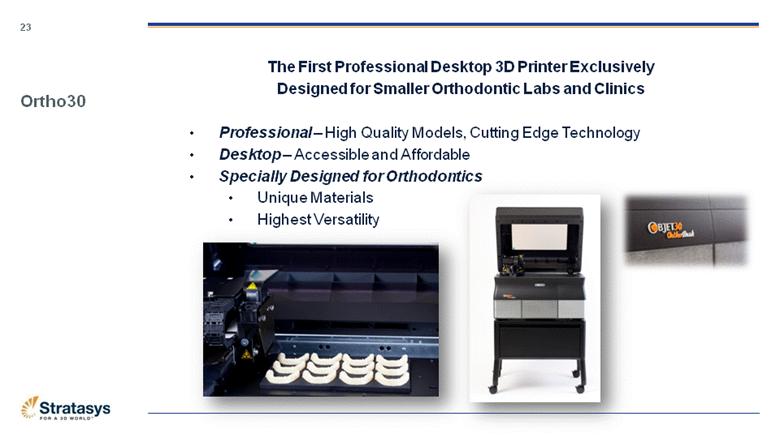
23 Ortho30 The First Professional Desktop 3D Printer Exclusively Designed for Smaller Orthodontic Labs and Clinics Professional – High Quality Models, Cutting Edge Technology Desktop – Accessible and Affordable Specially Designed for Orthodontics Unique Materials Highest Versatility |
|
|
Strong record first quarter results. Continued sales, marketing and service team integration, and are ahead of schedule in cross-training channel partners. Continuing to invest for the future through new product and channel develop programs. Maintaining and extending our technology lead and growing through strategic acquisitions. 24 Summary Observing heightened market interest and initiated a marketing campaign to raise market awareness among decision makers. Maintain positive outlook and strong growth expectations. |
|
|
Stratasys Q&A 25 We are passionate believers in the value and power of 3D printing, and in the change it can bring to the world. And we’re here to lead it. |
|
|
26 Reconciliation of Pro Forma GAAP to Pro Forma Non-GAAP Results of Operations Stratasys Ltd. Combined ($ in thousands except per share data) |
|
|
27 Reconciliation of Non-GAAP Adjustments Stratasys Ltd. Combined Q1-12 Q1-13 Net sales, products Deferred revenue step-up - $ 1,015 $ Cost of sales, products Objet intangible assets amortization expense (9,824) (18,295) Solidscape intangible assets amortization expense (436) (436) Non-cash stock-based compensation expense (262) (318) Merger related expense - (97) Fasotech Co., Ltd intangible assets amortization expense - (31) (10,522) (19,177) Cost of sales, services Non-cash stock-based compensation expense (347) (316) Merger related expense - (27) (347) (343) Research and development, net Non-cash stock-based compensation expense (871) (899) Selling, general and administrative Objet intangible assets amortization expense (2,242) (5,276) Solidscape intangible assets amortization expense (133) (133) Fasotech Co., Ltd intangible assets amortization expense - (52) Non-cash stock-based compensation expense (5,113) (3,957) Solidscape acquisition expense (130) - Merger related expense (3,057) (6,190) (10,675) (15,608) Income taxes Tax expense related to non-GAAP adjustments 1,453 3,886 Net income attributable to non-controlling interest Depreciation and amortization expense attributable to non-controlling interest - 40 Net income 20,962 $ 33,116 $ |